Sales Dashboard

Can our sales dashboard be more insightful and actionable for all the team members?
Data VisualizationE-commerceInternal Tools
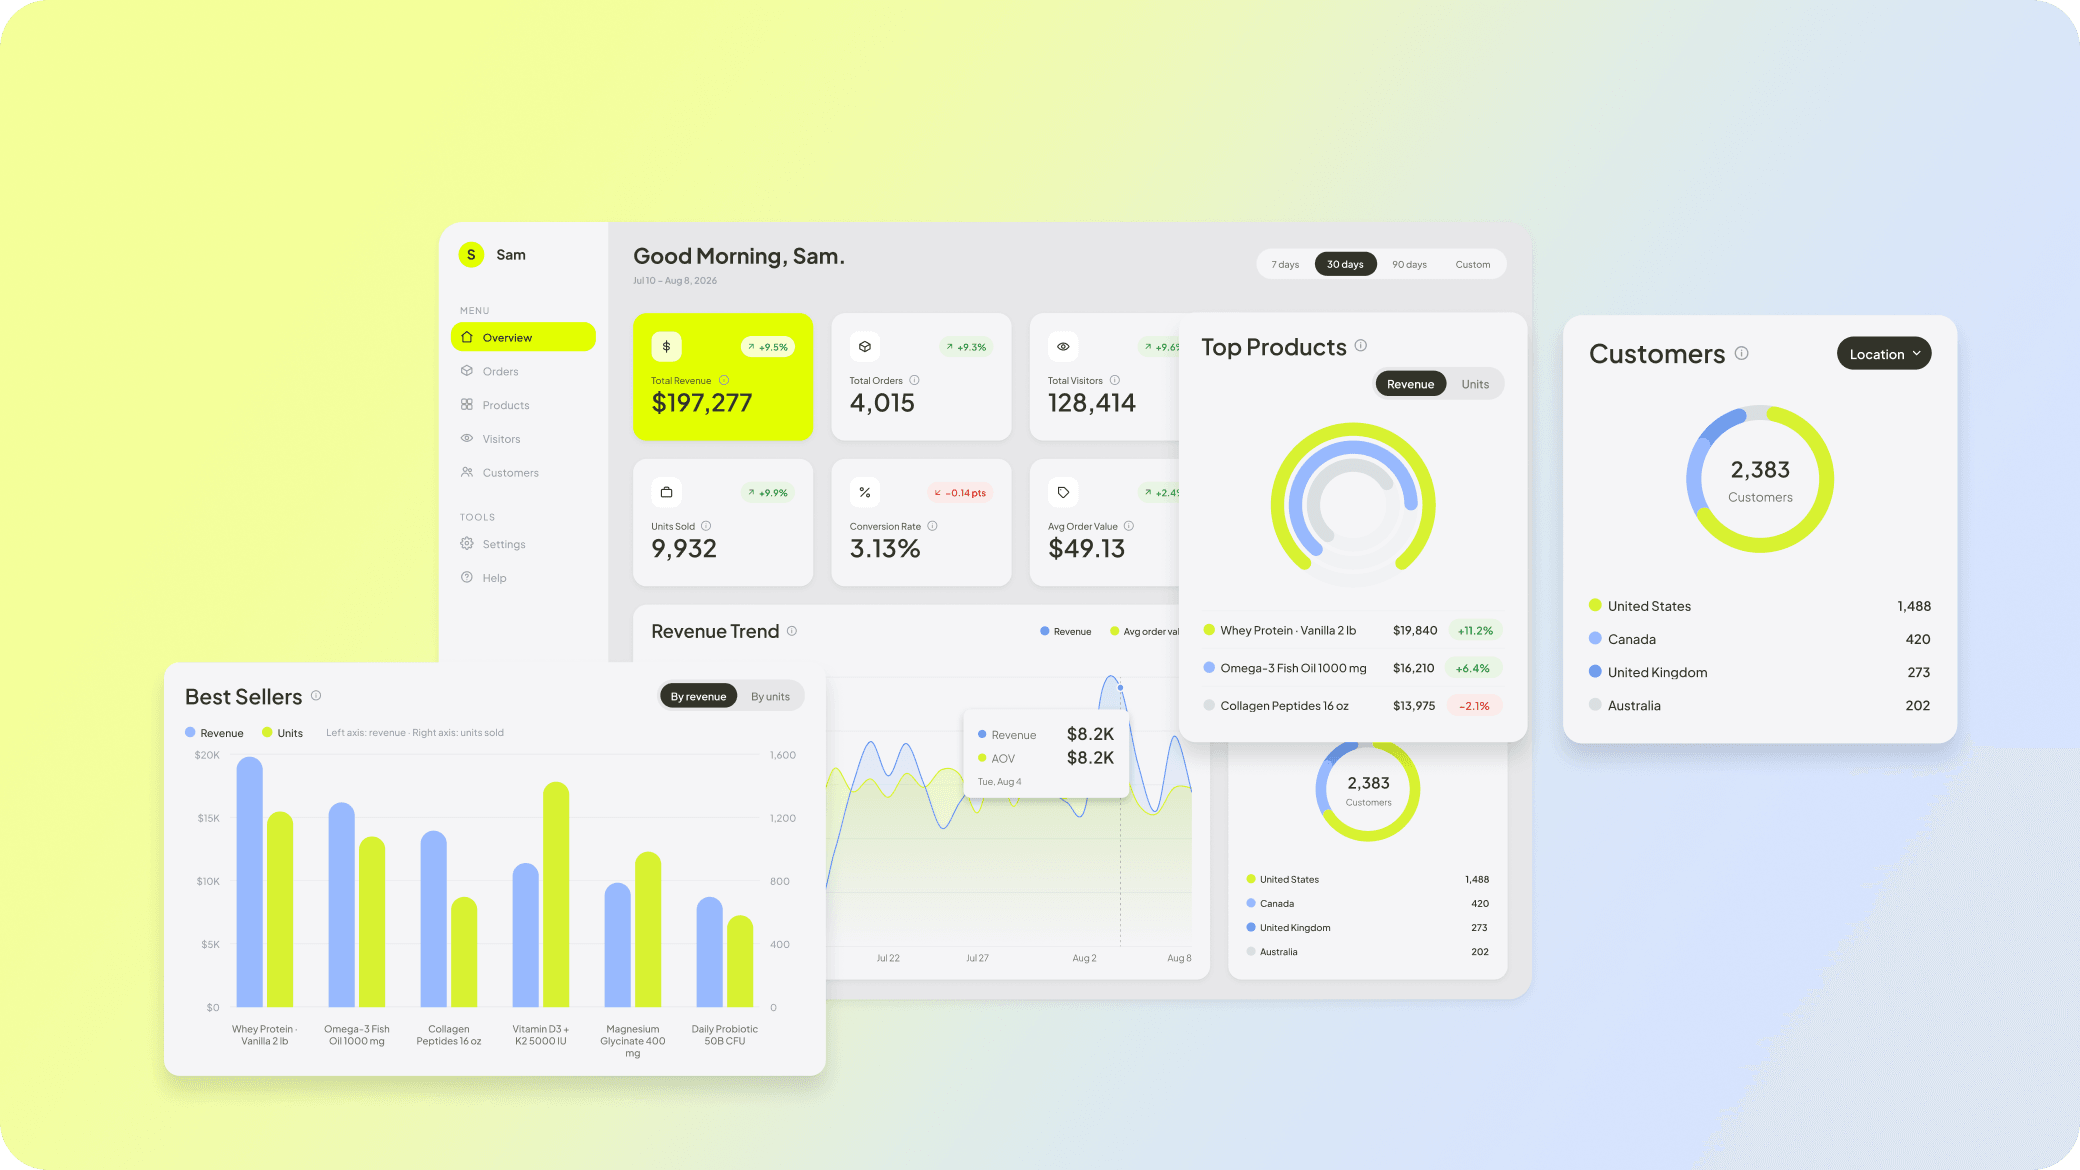
The Sales Dashboard overview, with revenue trend, top products and customer breakdown.

PROBLEM

The data existed everywhere. The answers existed nowhere.

Selling vitamins is not like selling t-shirts. A customer who buys a 60-day bottle should be back in about 60 days. If they're not, something quietly went wrong.

Products expire on shelves. Returns and refunds happen, and nothing gets fixed at the root. This is a business that runs on rhythm. But all the numbers lived in different places — the store admin, analytics tools, spreadsheets. No one could answer the morning questions in one place. Are we okay today? What needs my attention? How can we grow sales? How can we cut down returns? How can we lift the page conversion rate?

Solution

A dashboard answers all the questions for all kinds of users at a glance.
RESEARCH

The users span all types, from owner, marketing team, operations team, inventory team, to customer support.
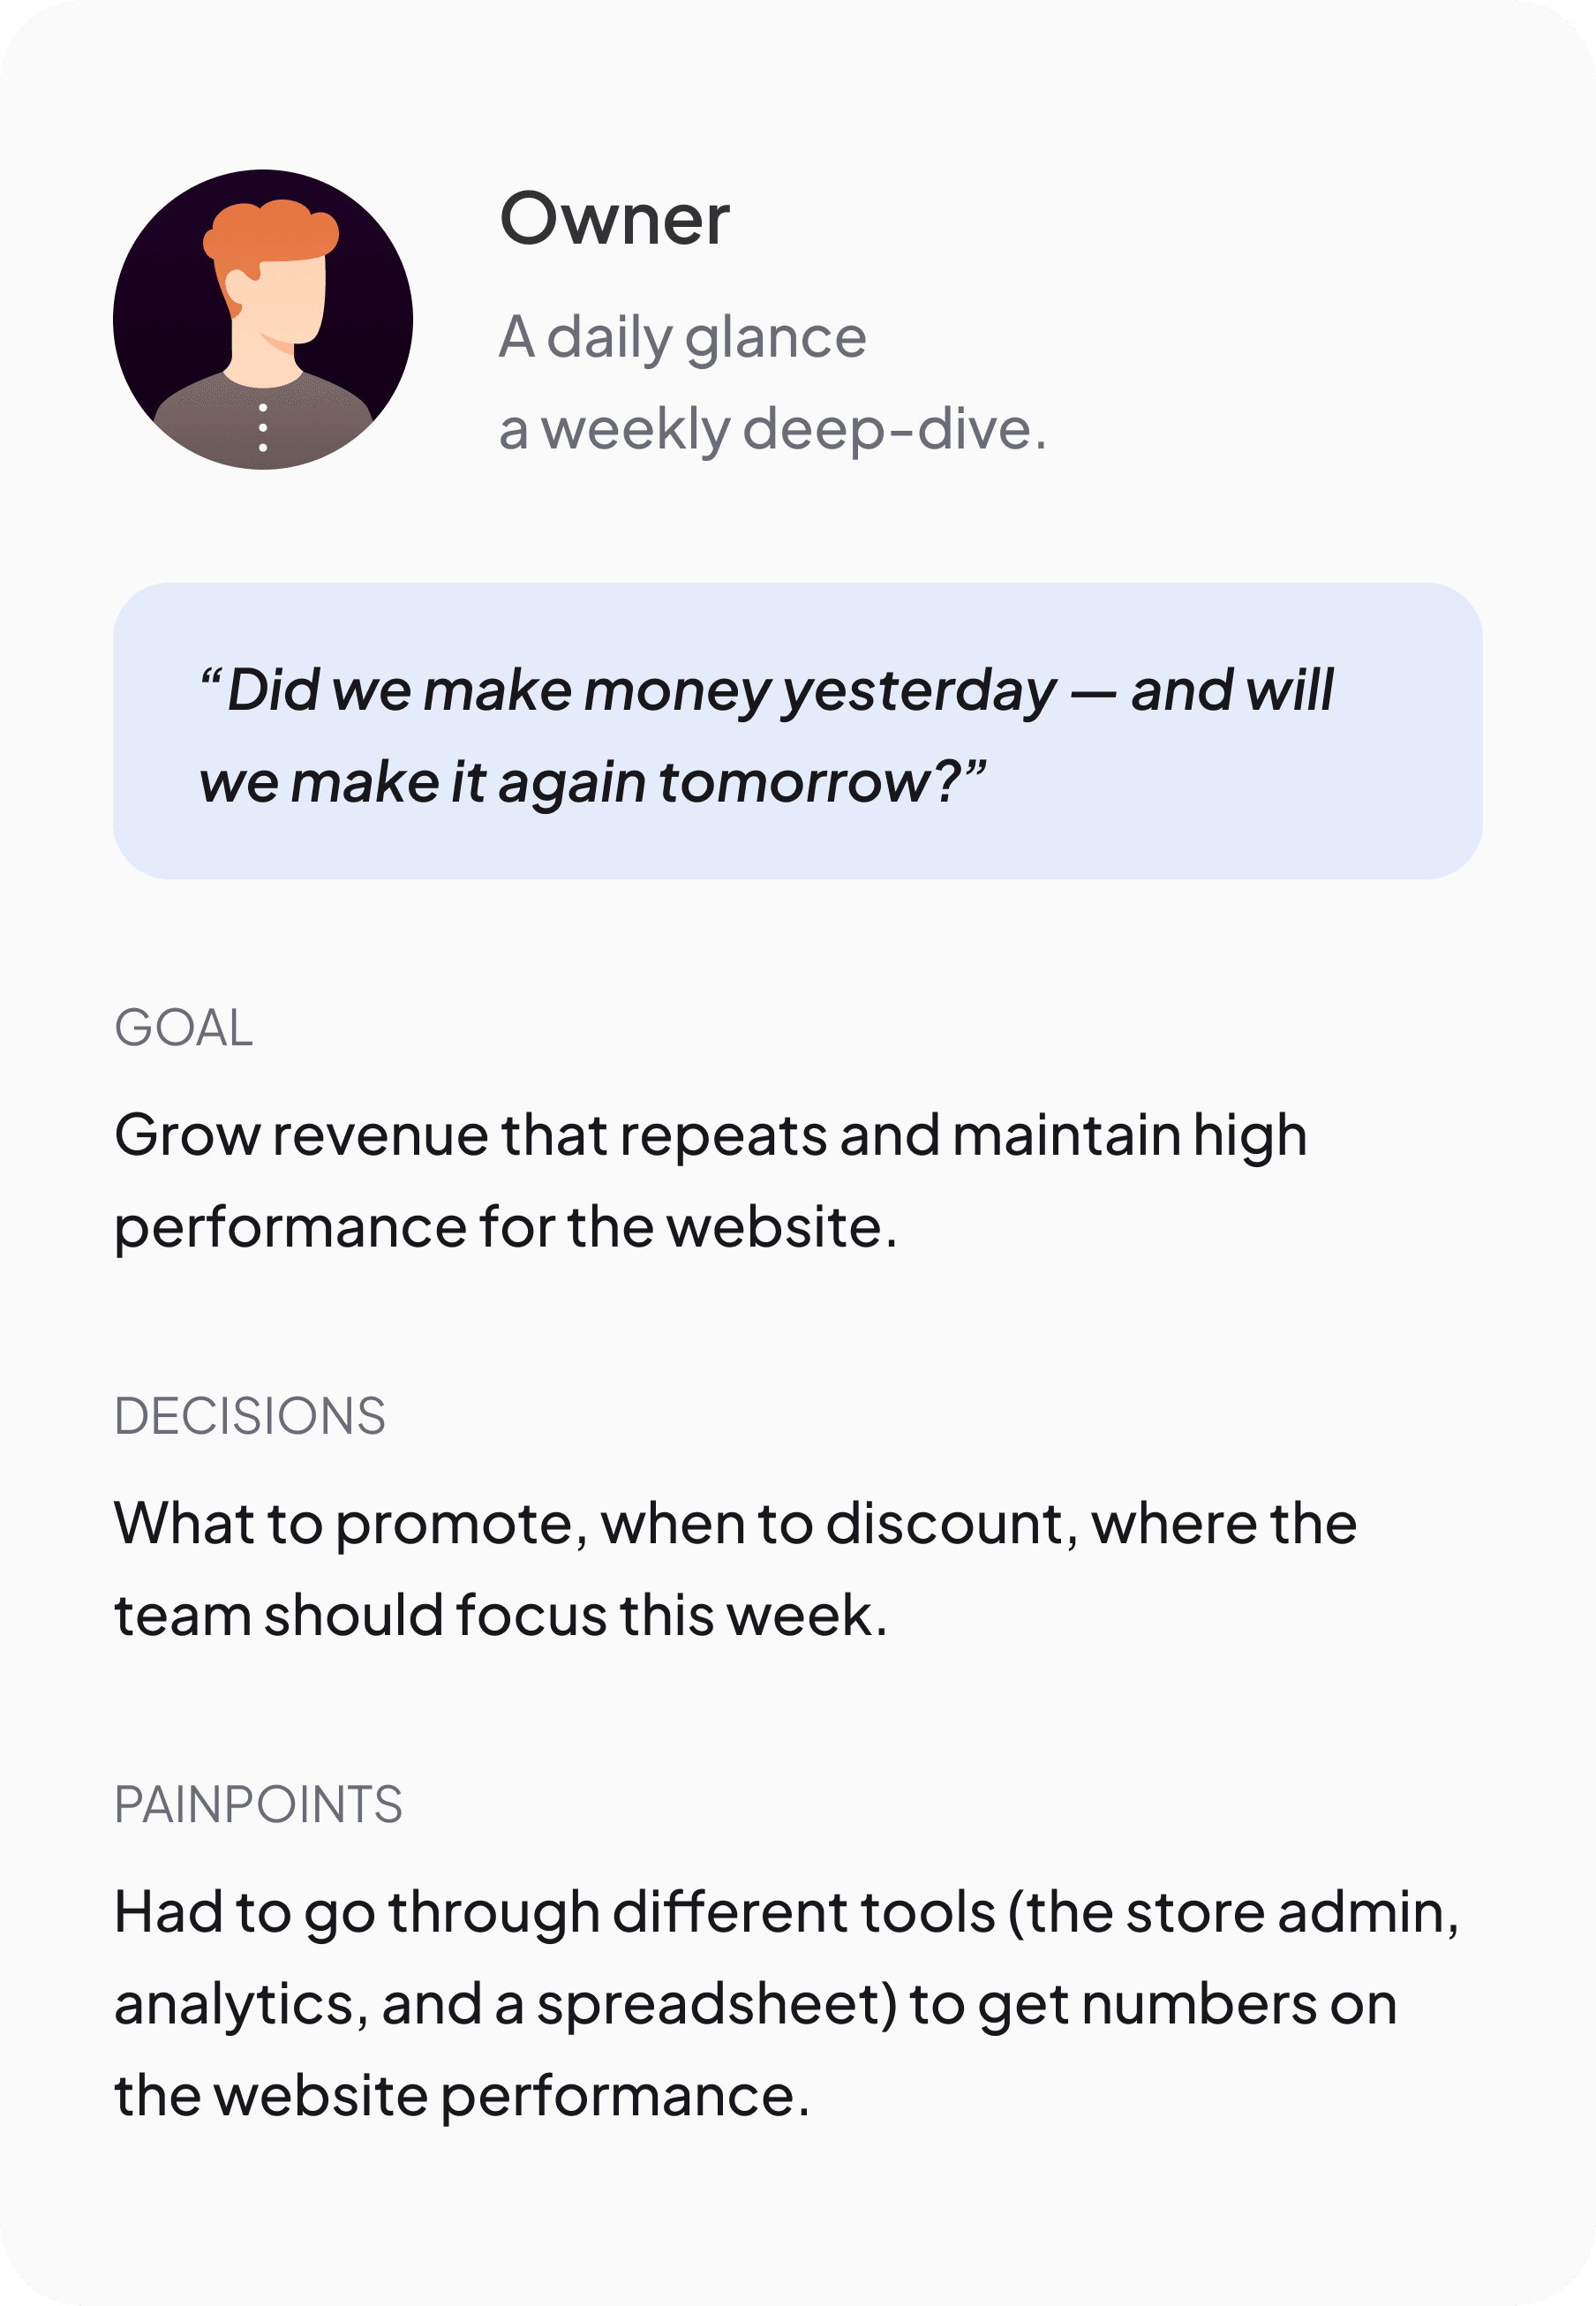
Owner persona — checks in daily, deep-dives weekly. Asks whether the business made money yesterday and will again tomorrow. Wants repeatable revenue; previously had to cross-reference the store admin, analytics and a spreadsheet.
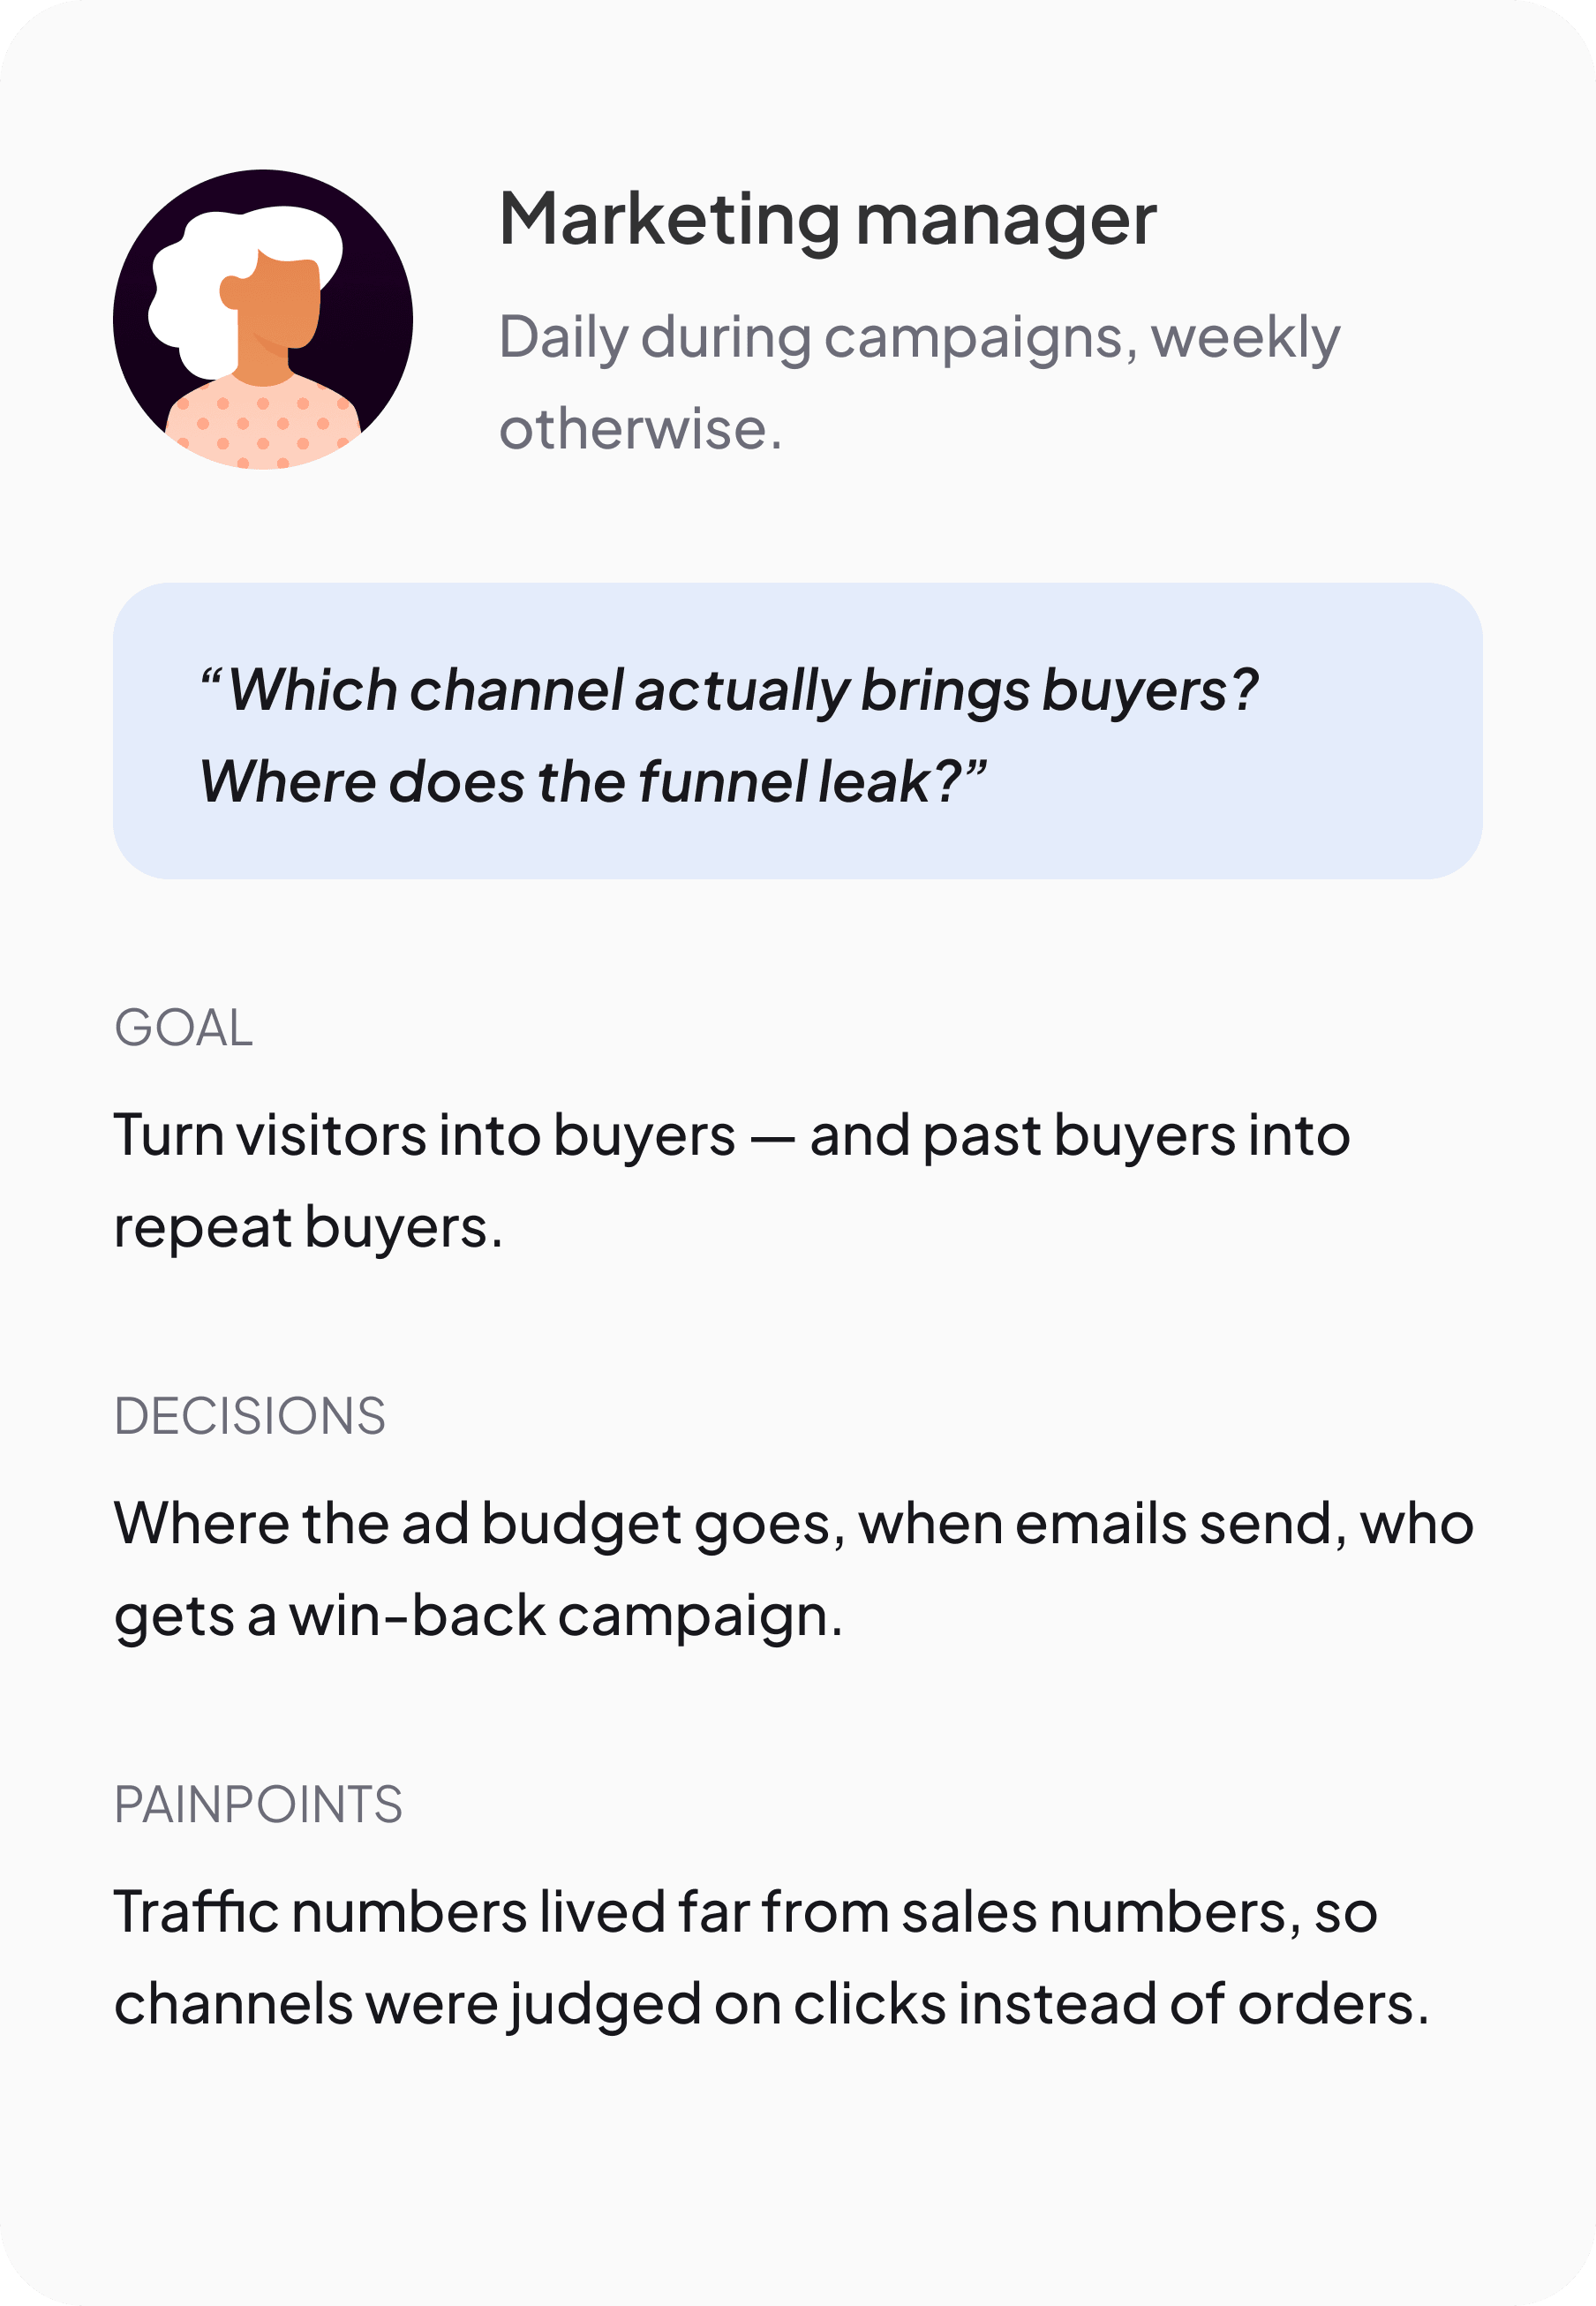
Marketing manager persona — daily during campaigns. Asks which channel actually brings buyers and where the funnel leaks. Traffic numbers used to sit far from sales numbers, so channels were judged on clicks instead of orders.
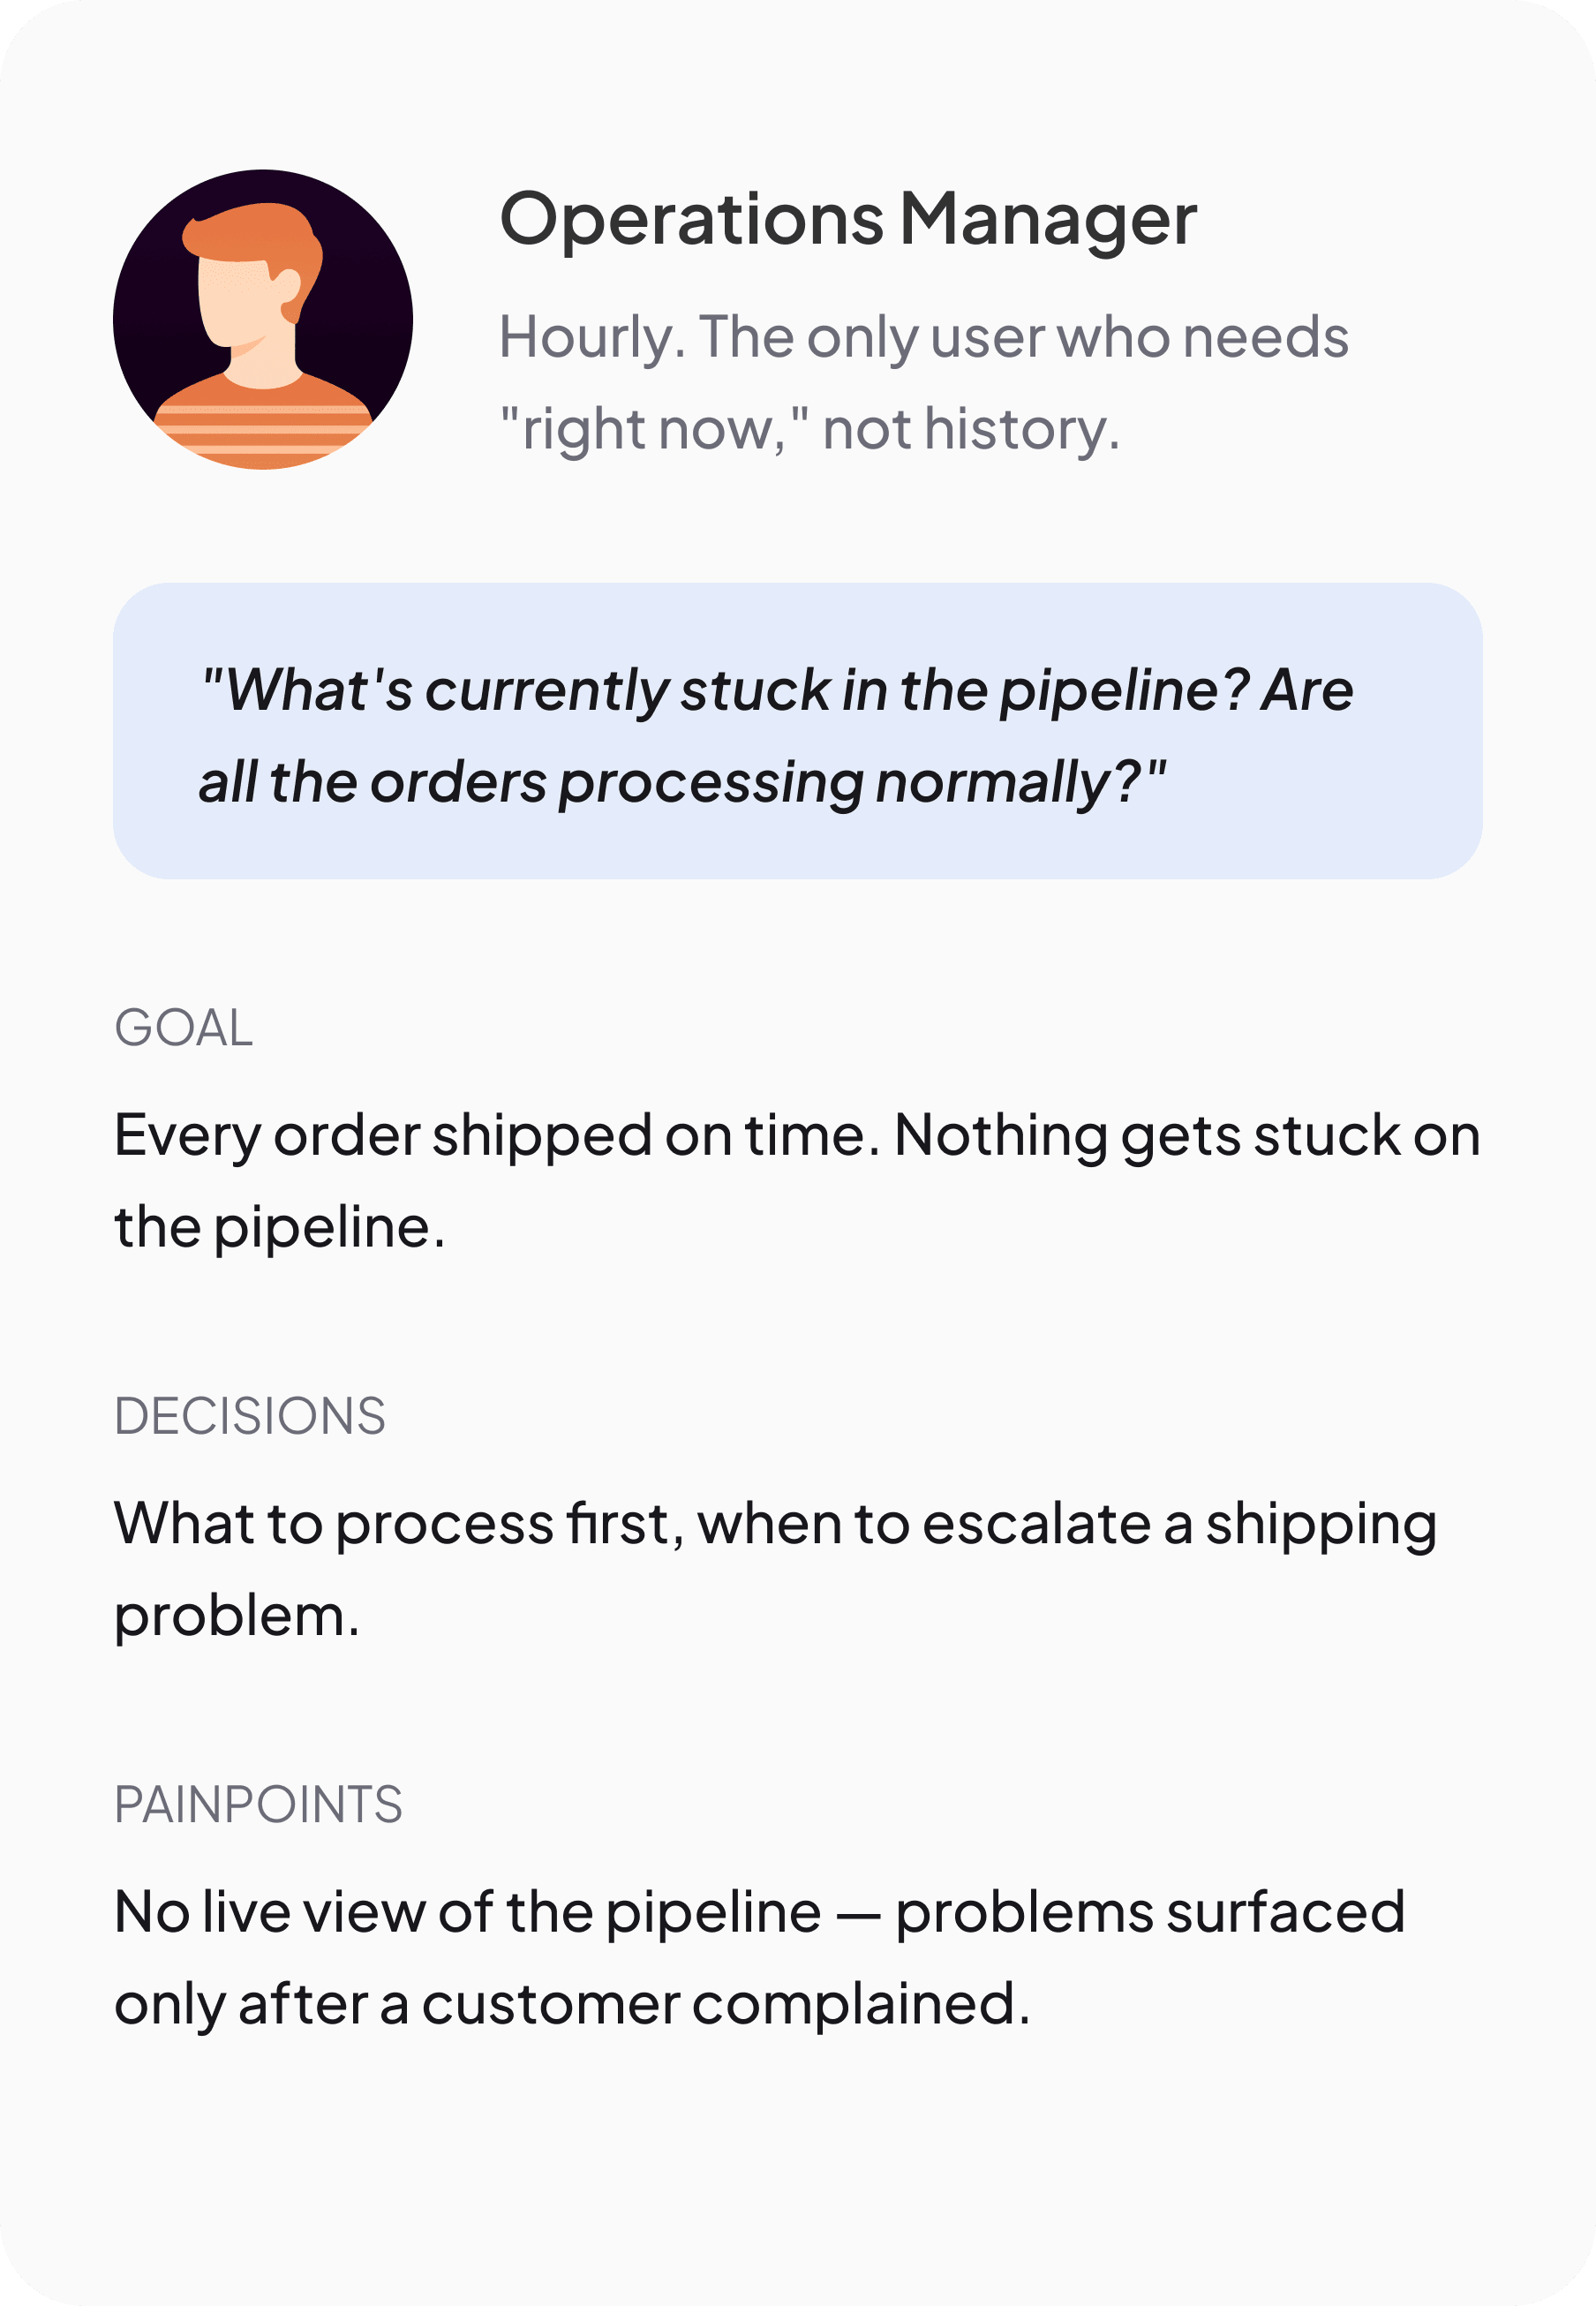
Operations Manager persona — checks hourly and needs right-now data, not history. Asks what is stuck in the pipeline. Had no live view, so problems surfaced only after a customer complained.
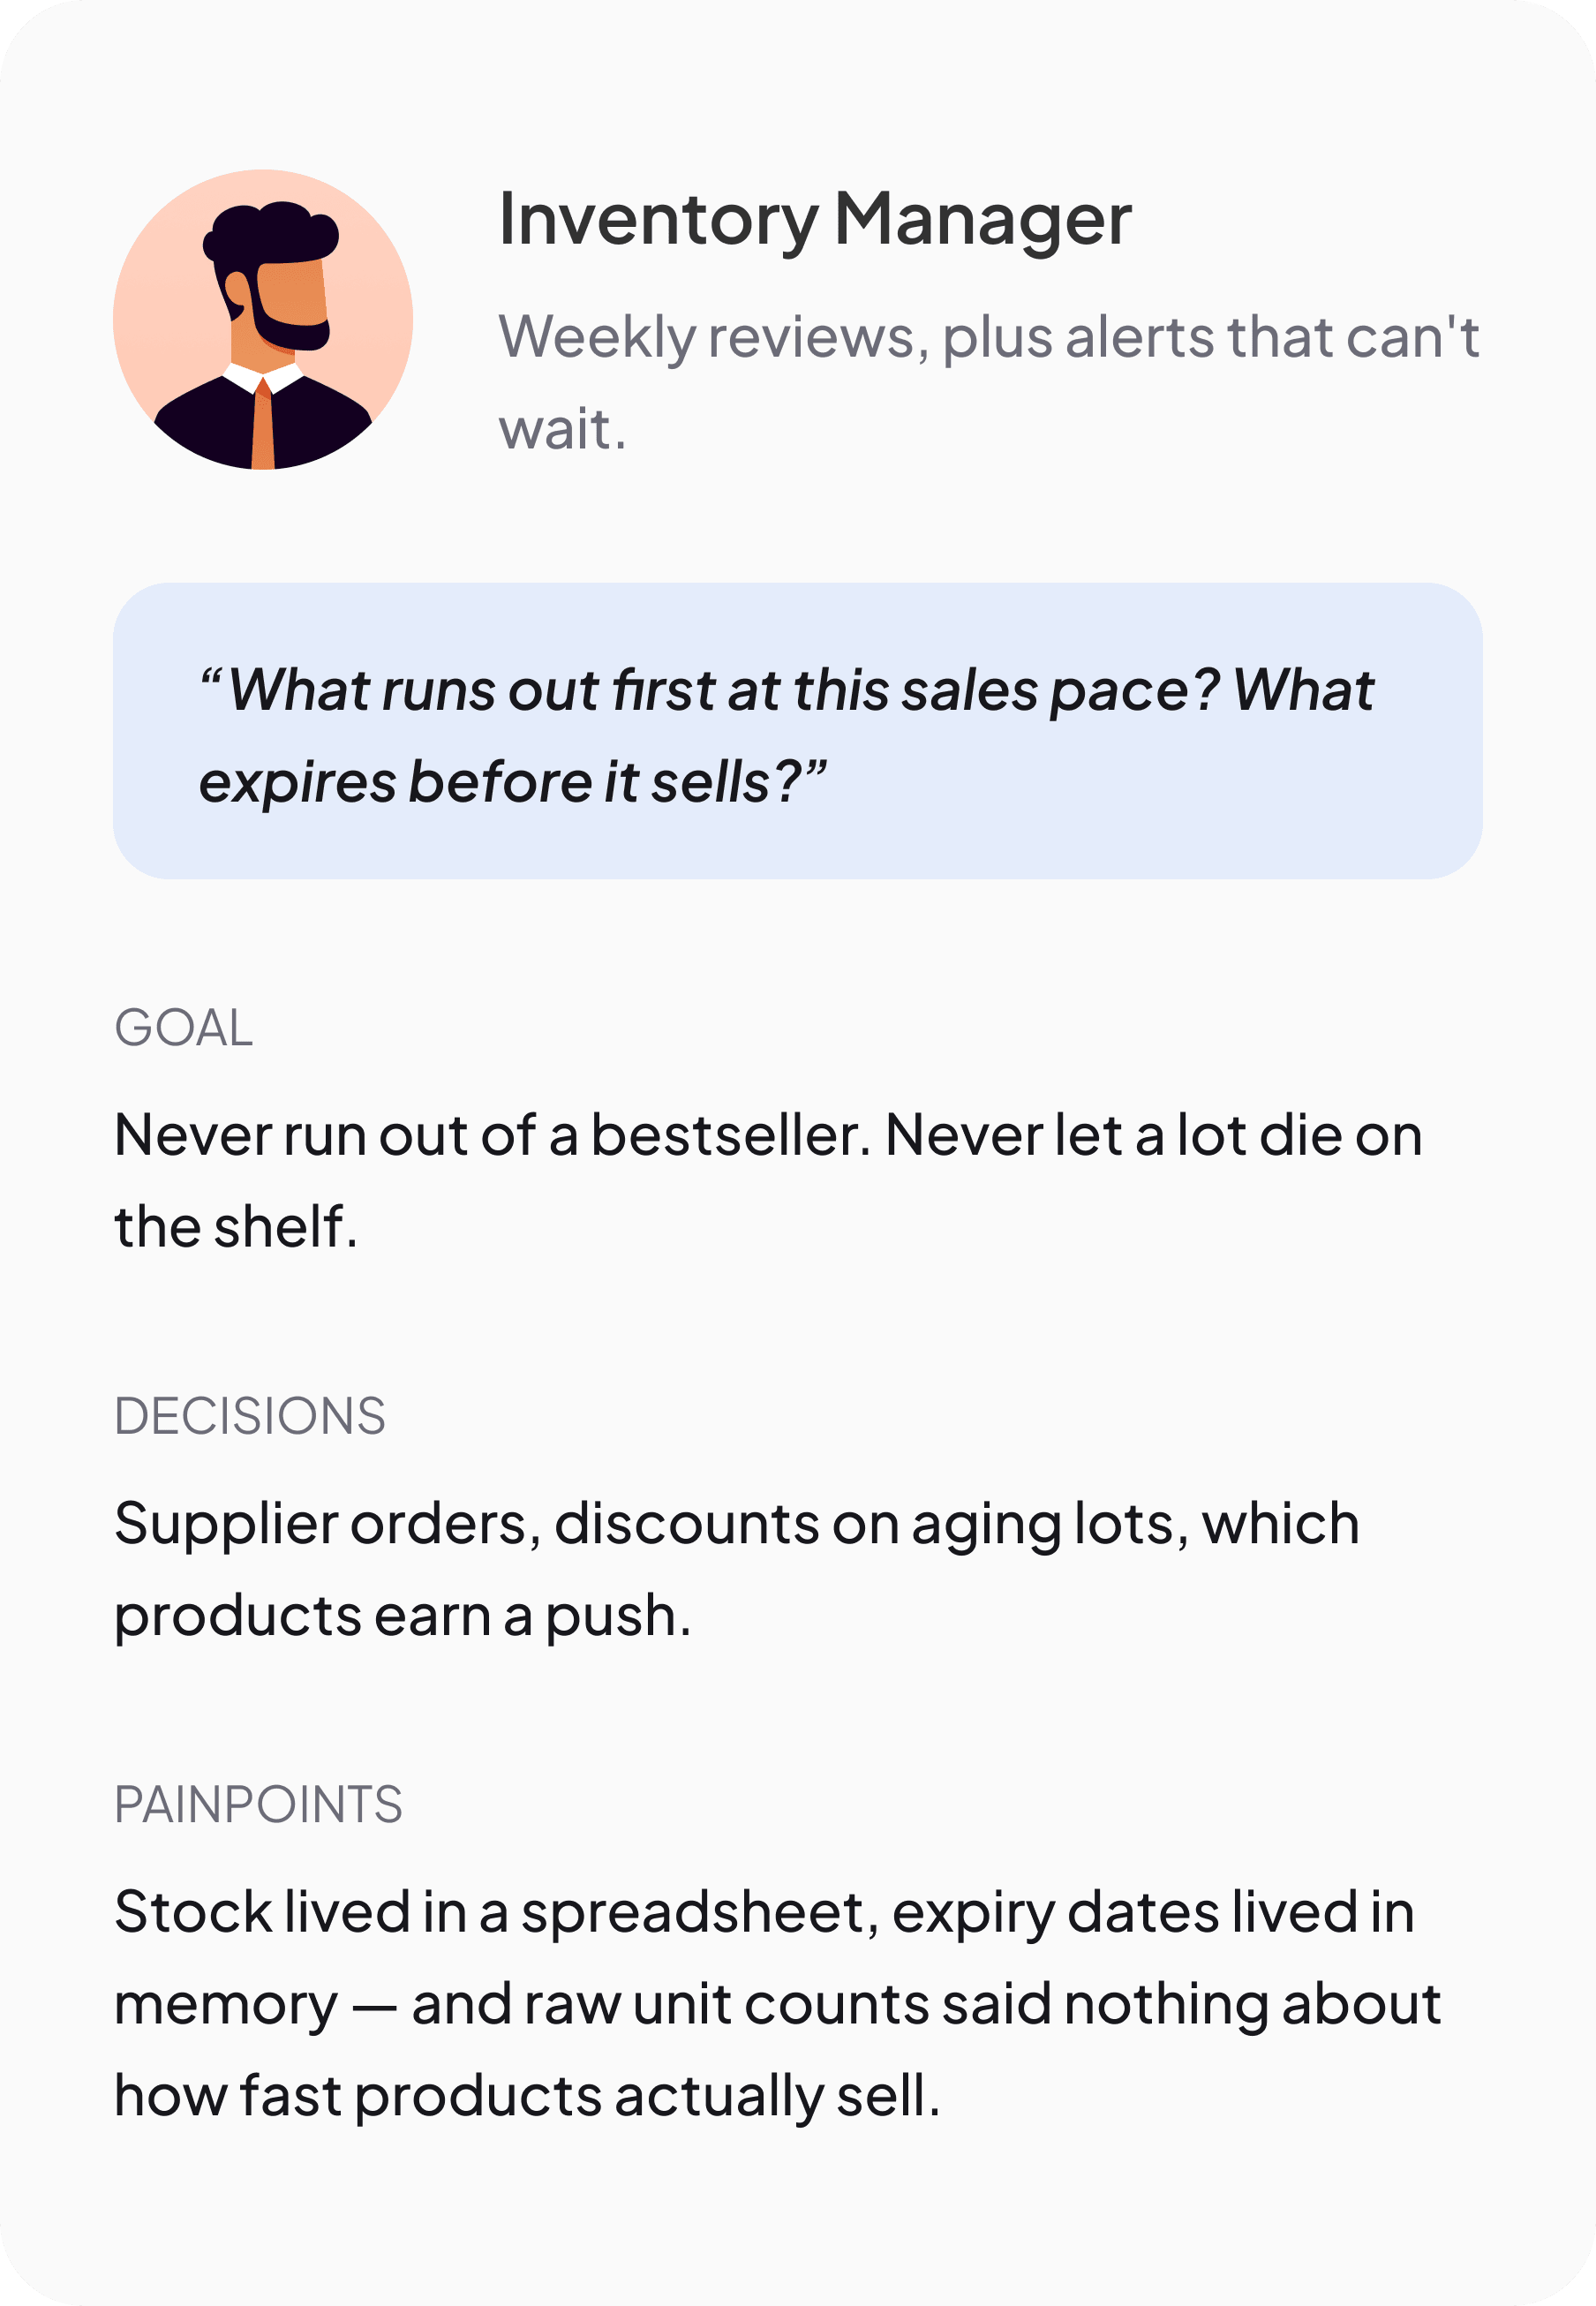
Inventory Manager persona — weekly reviews plus urgent alerts. Asks what runs out first at this sales pace and what expires before it sells. Stock lived in a spreadsheet and expiry dates lived in memory.
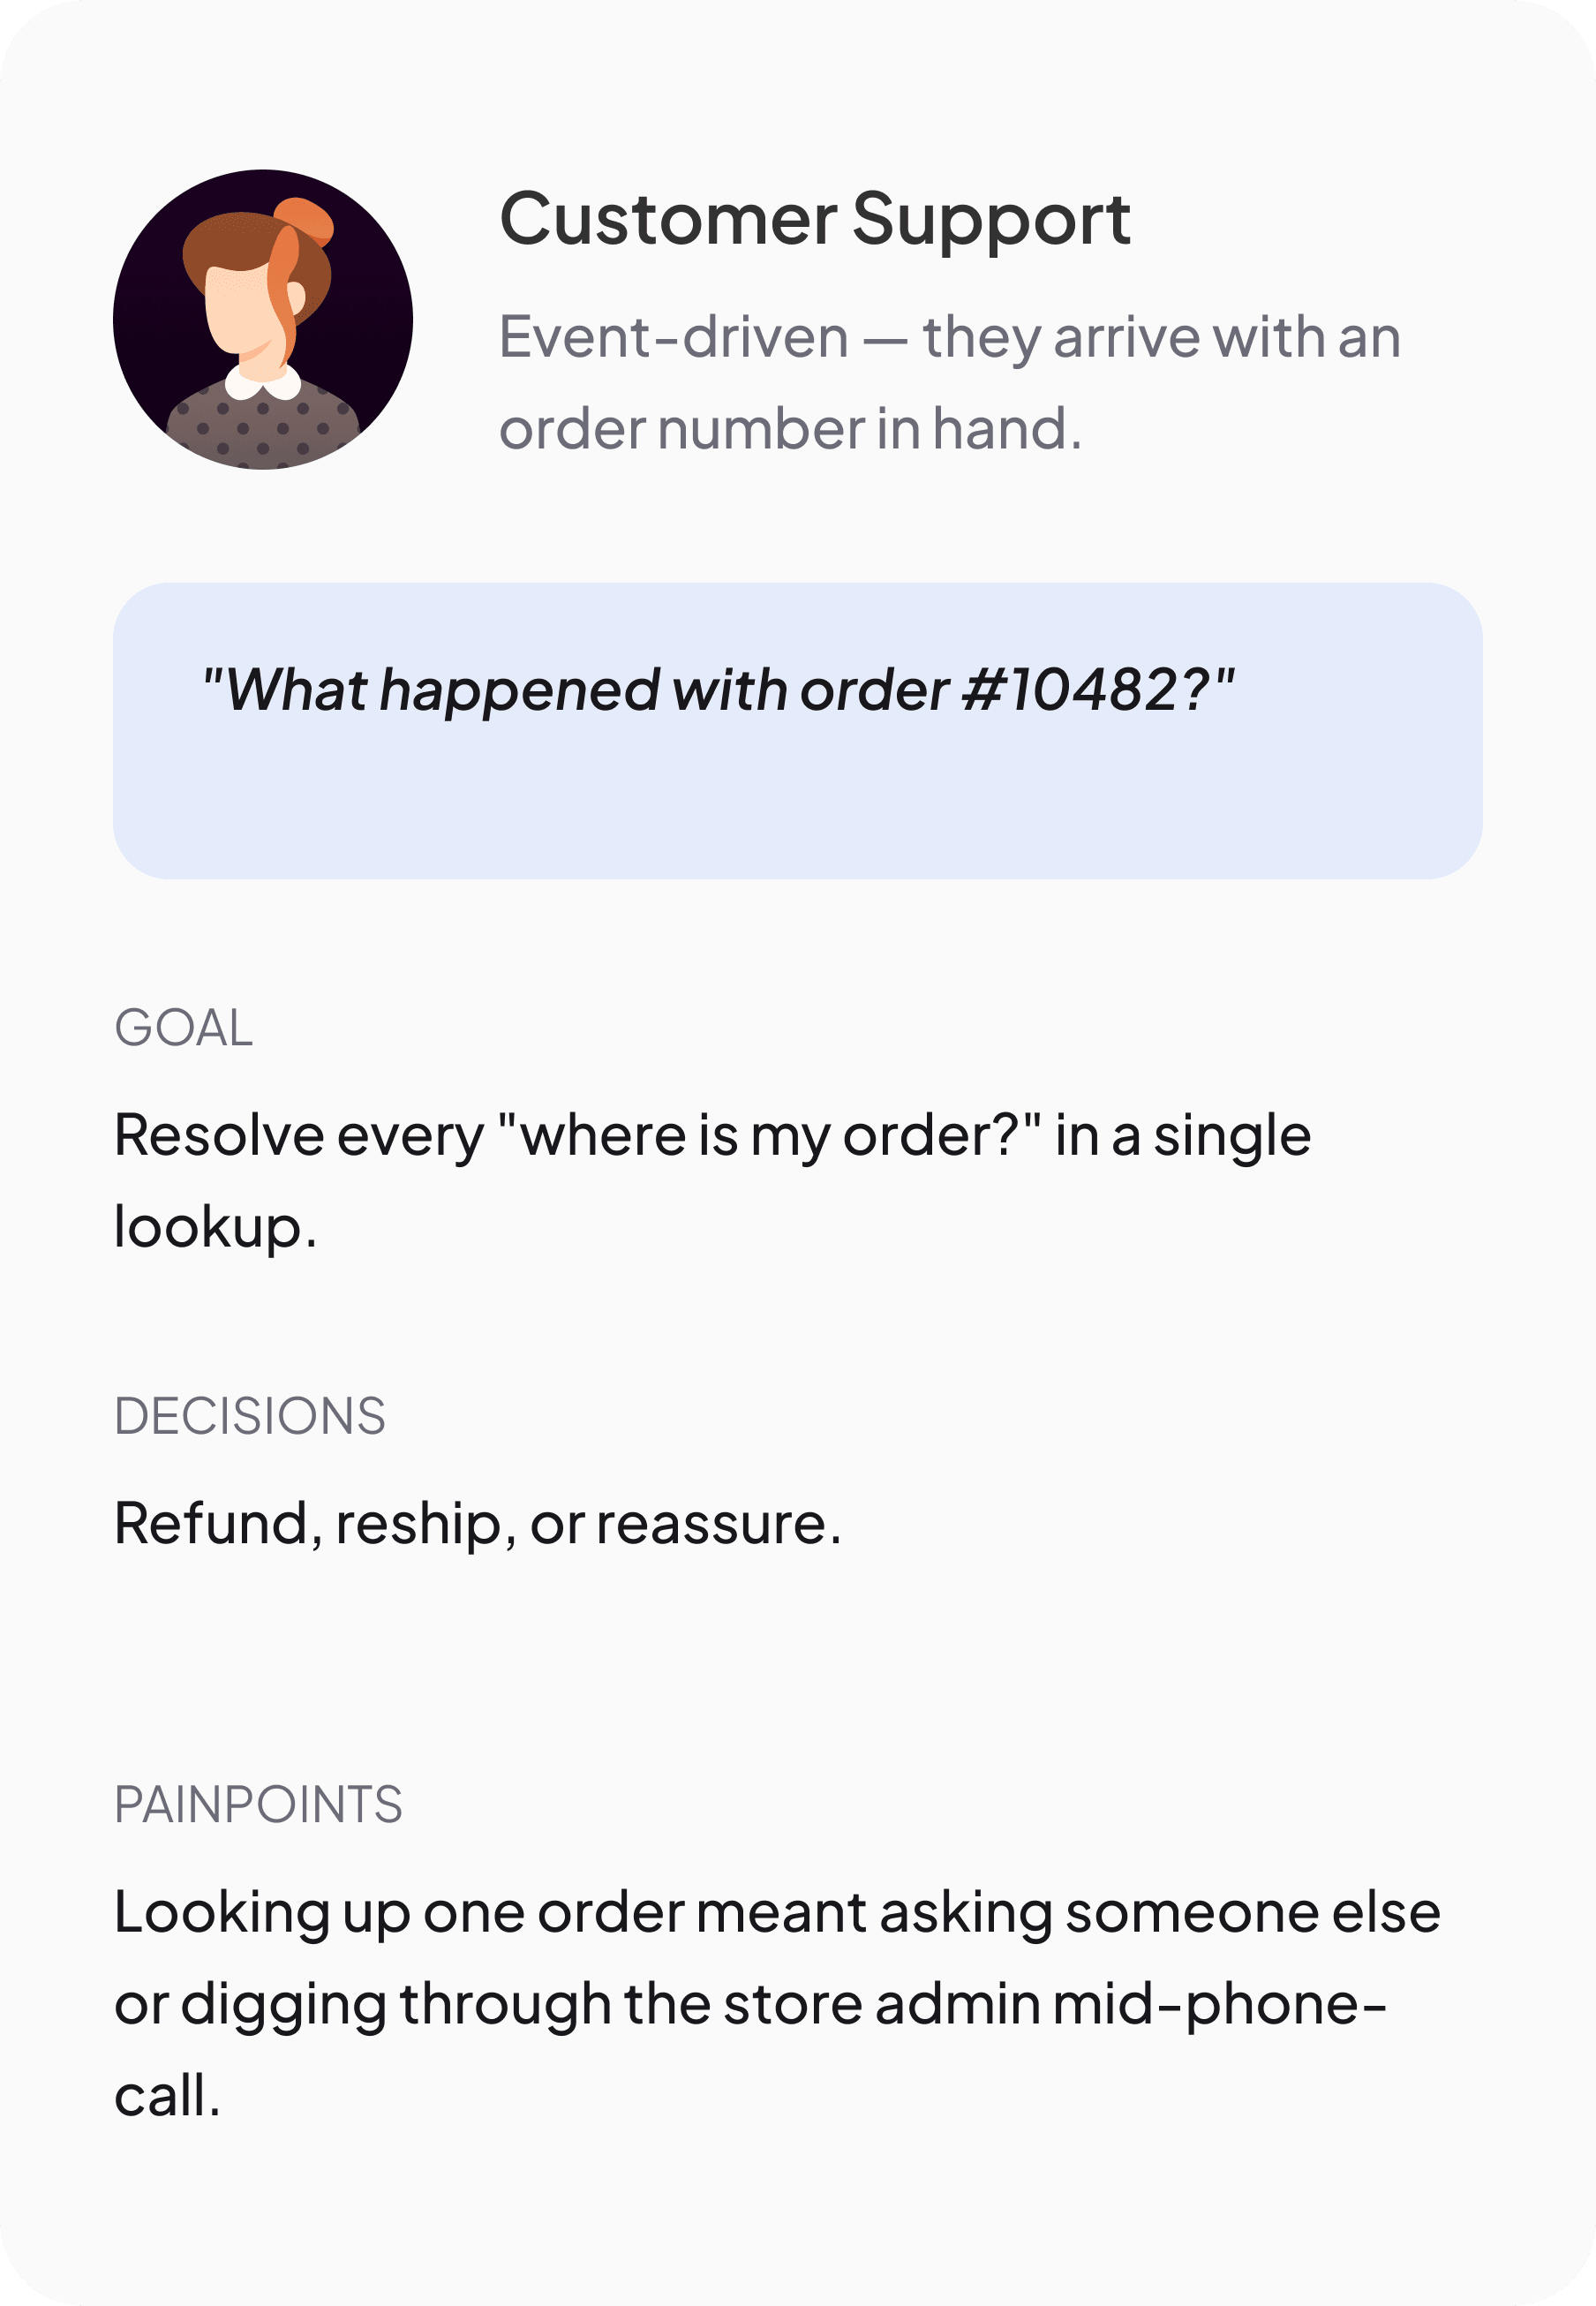
Customer Support persona — event-driven, arrives with an order number. Needs to resolve any where-is-my-order question in a single lookup, instead of digging through the store admin mid-call.

Ideation

Every metric on screen traces back to a person's question.
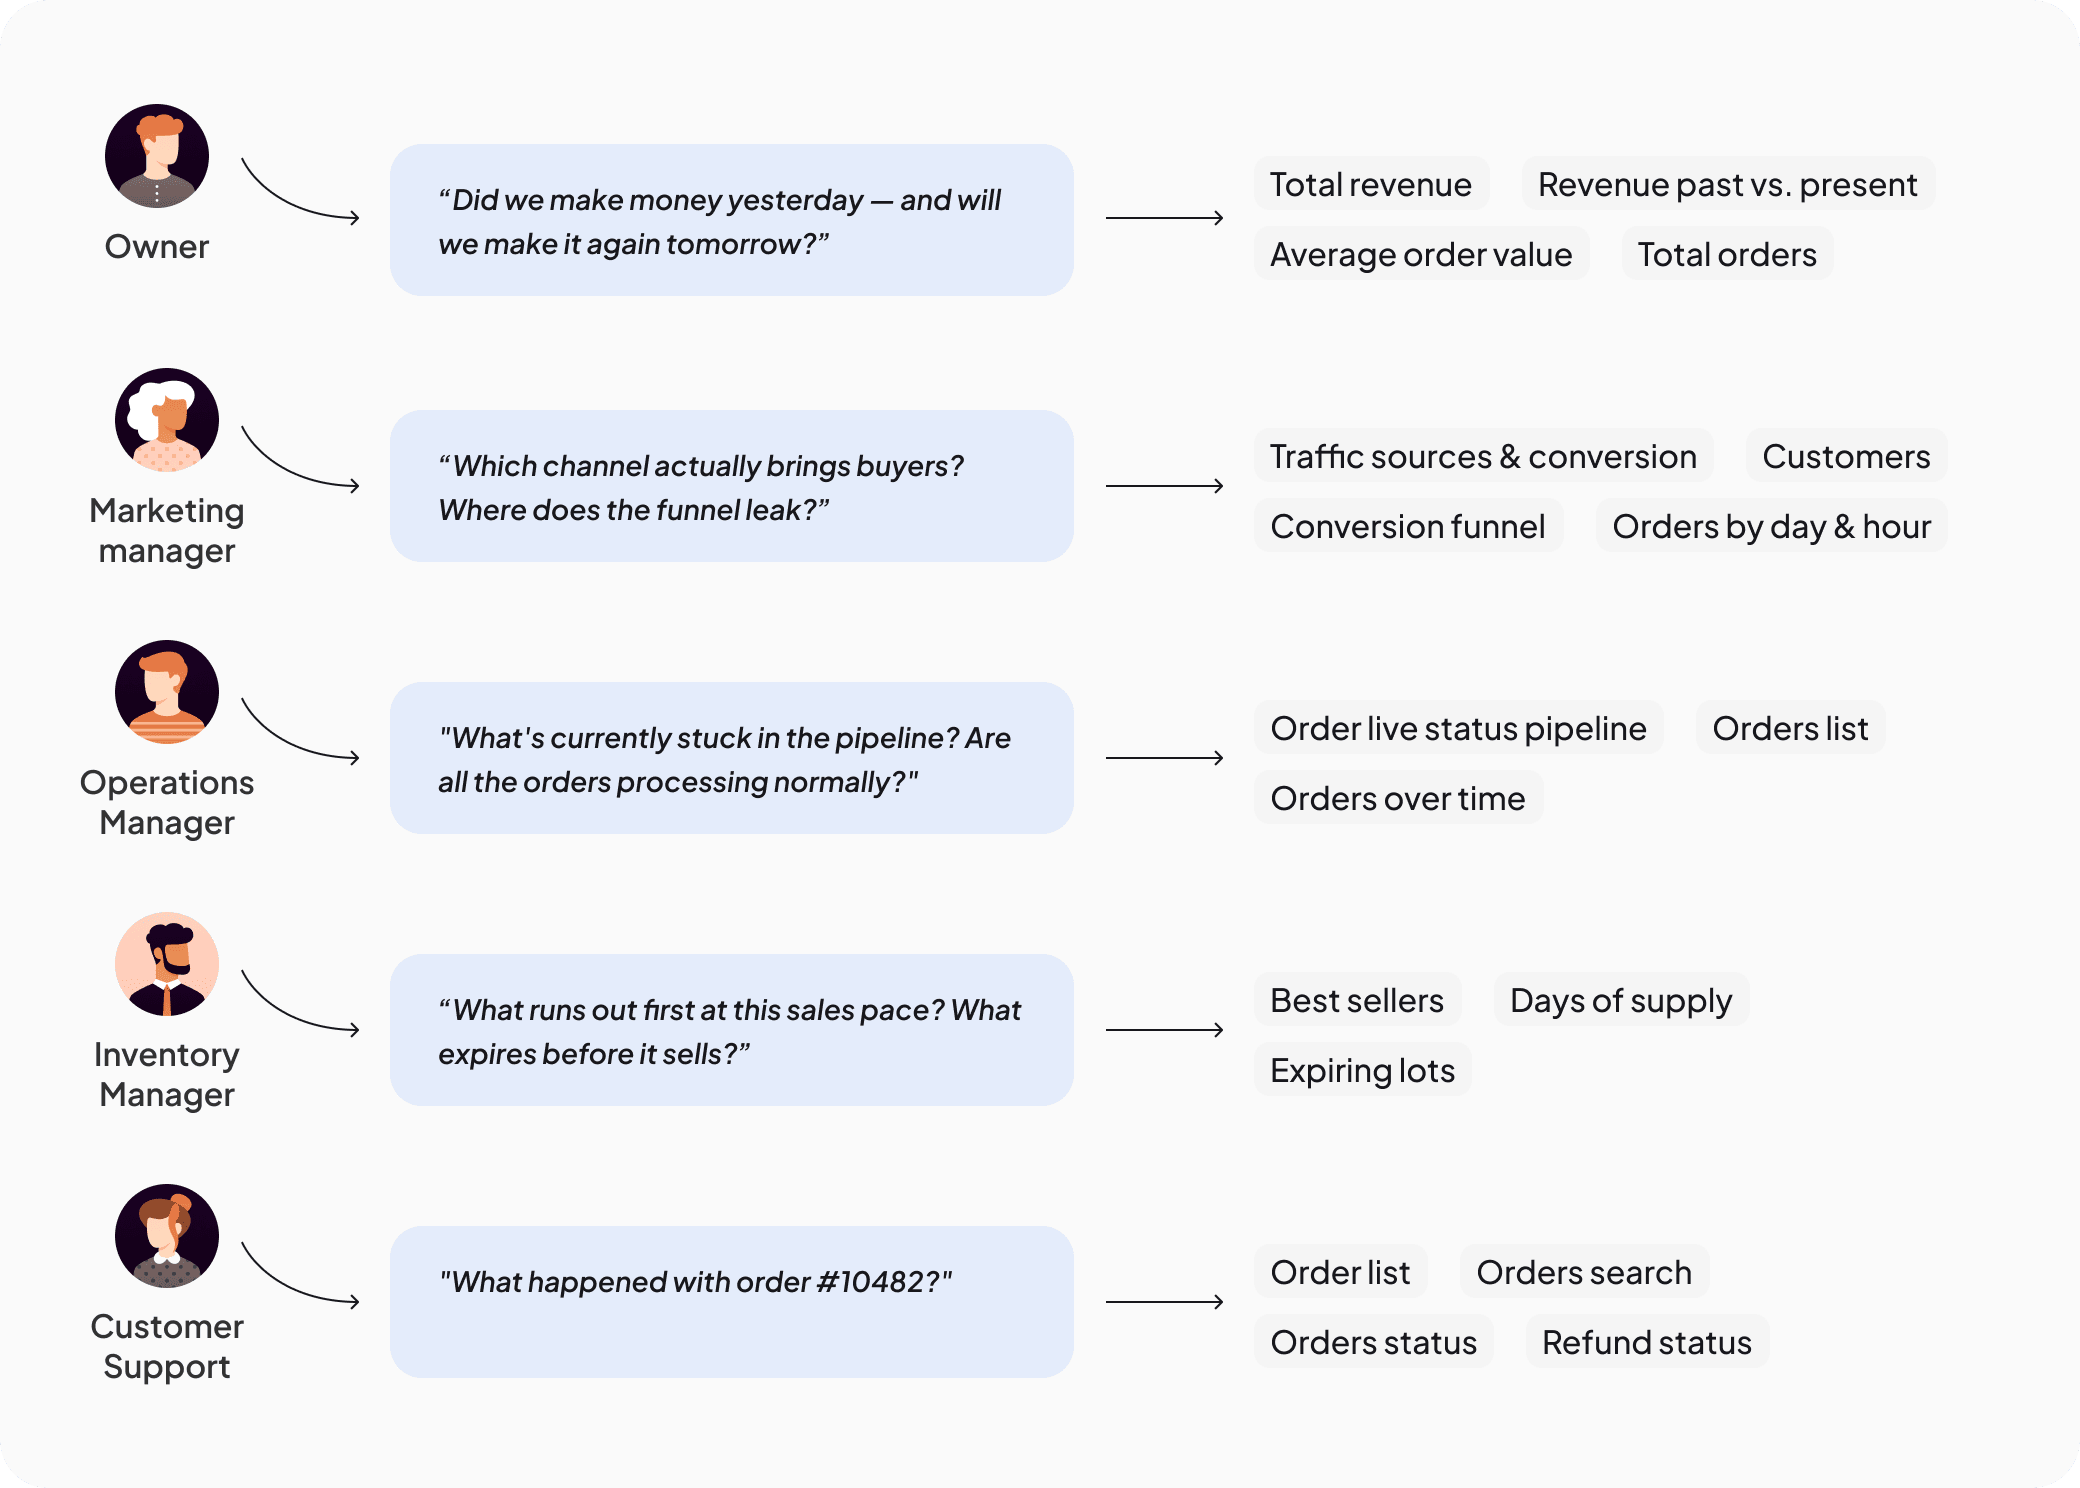
Each persona's question mapped to the metrics that answer it.

Ideation

Five pages, one rhythm: judge → diagnose → investigate
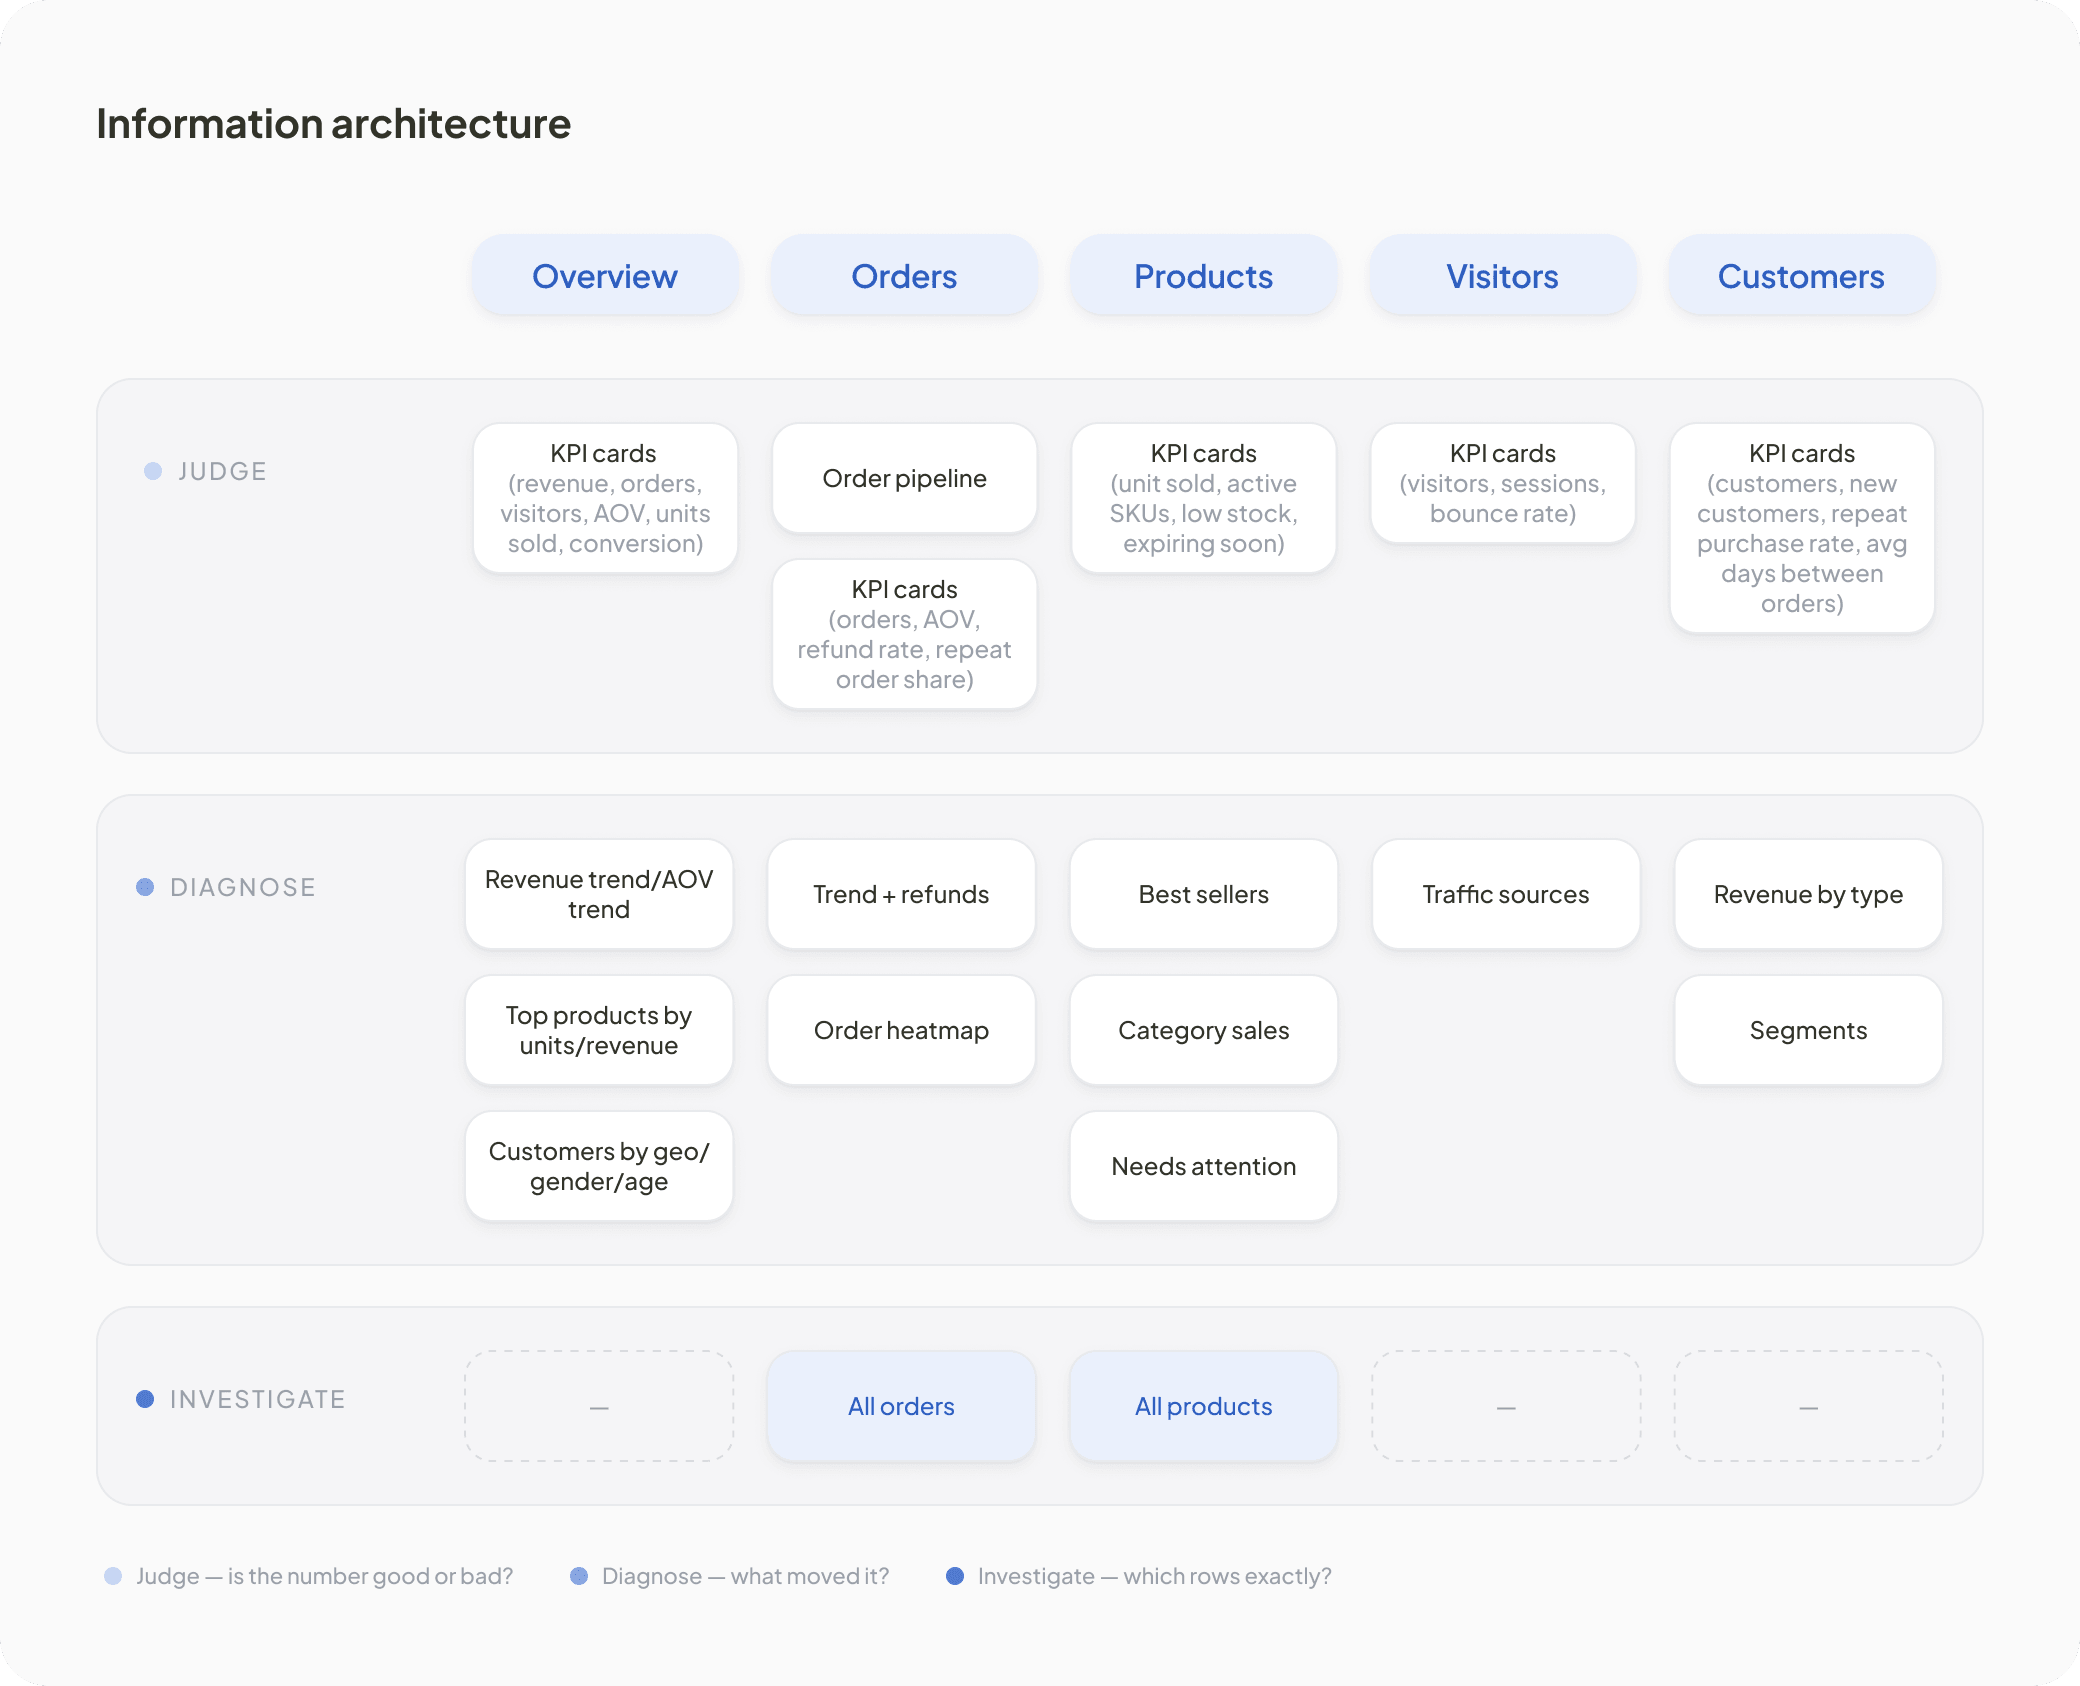
Information architecture — the five pages against judge, diagnose and investigate.

DESIGN

Every number arrives with context: a delta, a comparison, and a plain-sentence explanation on hover.
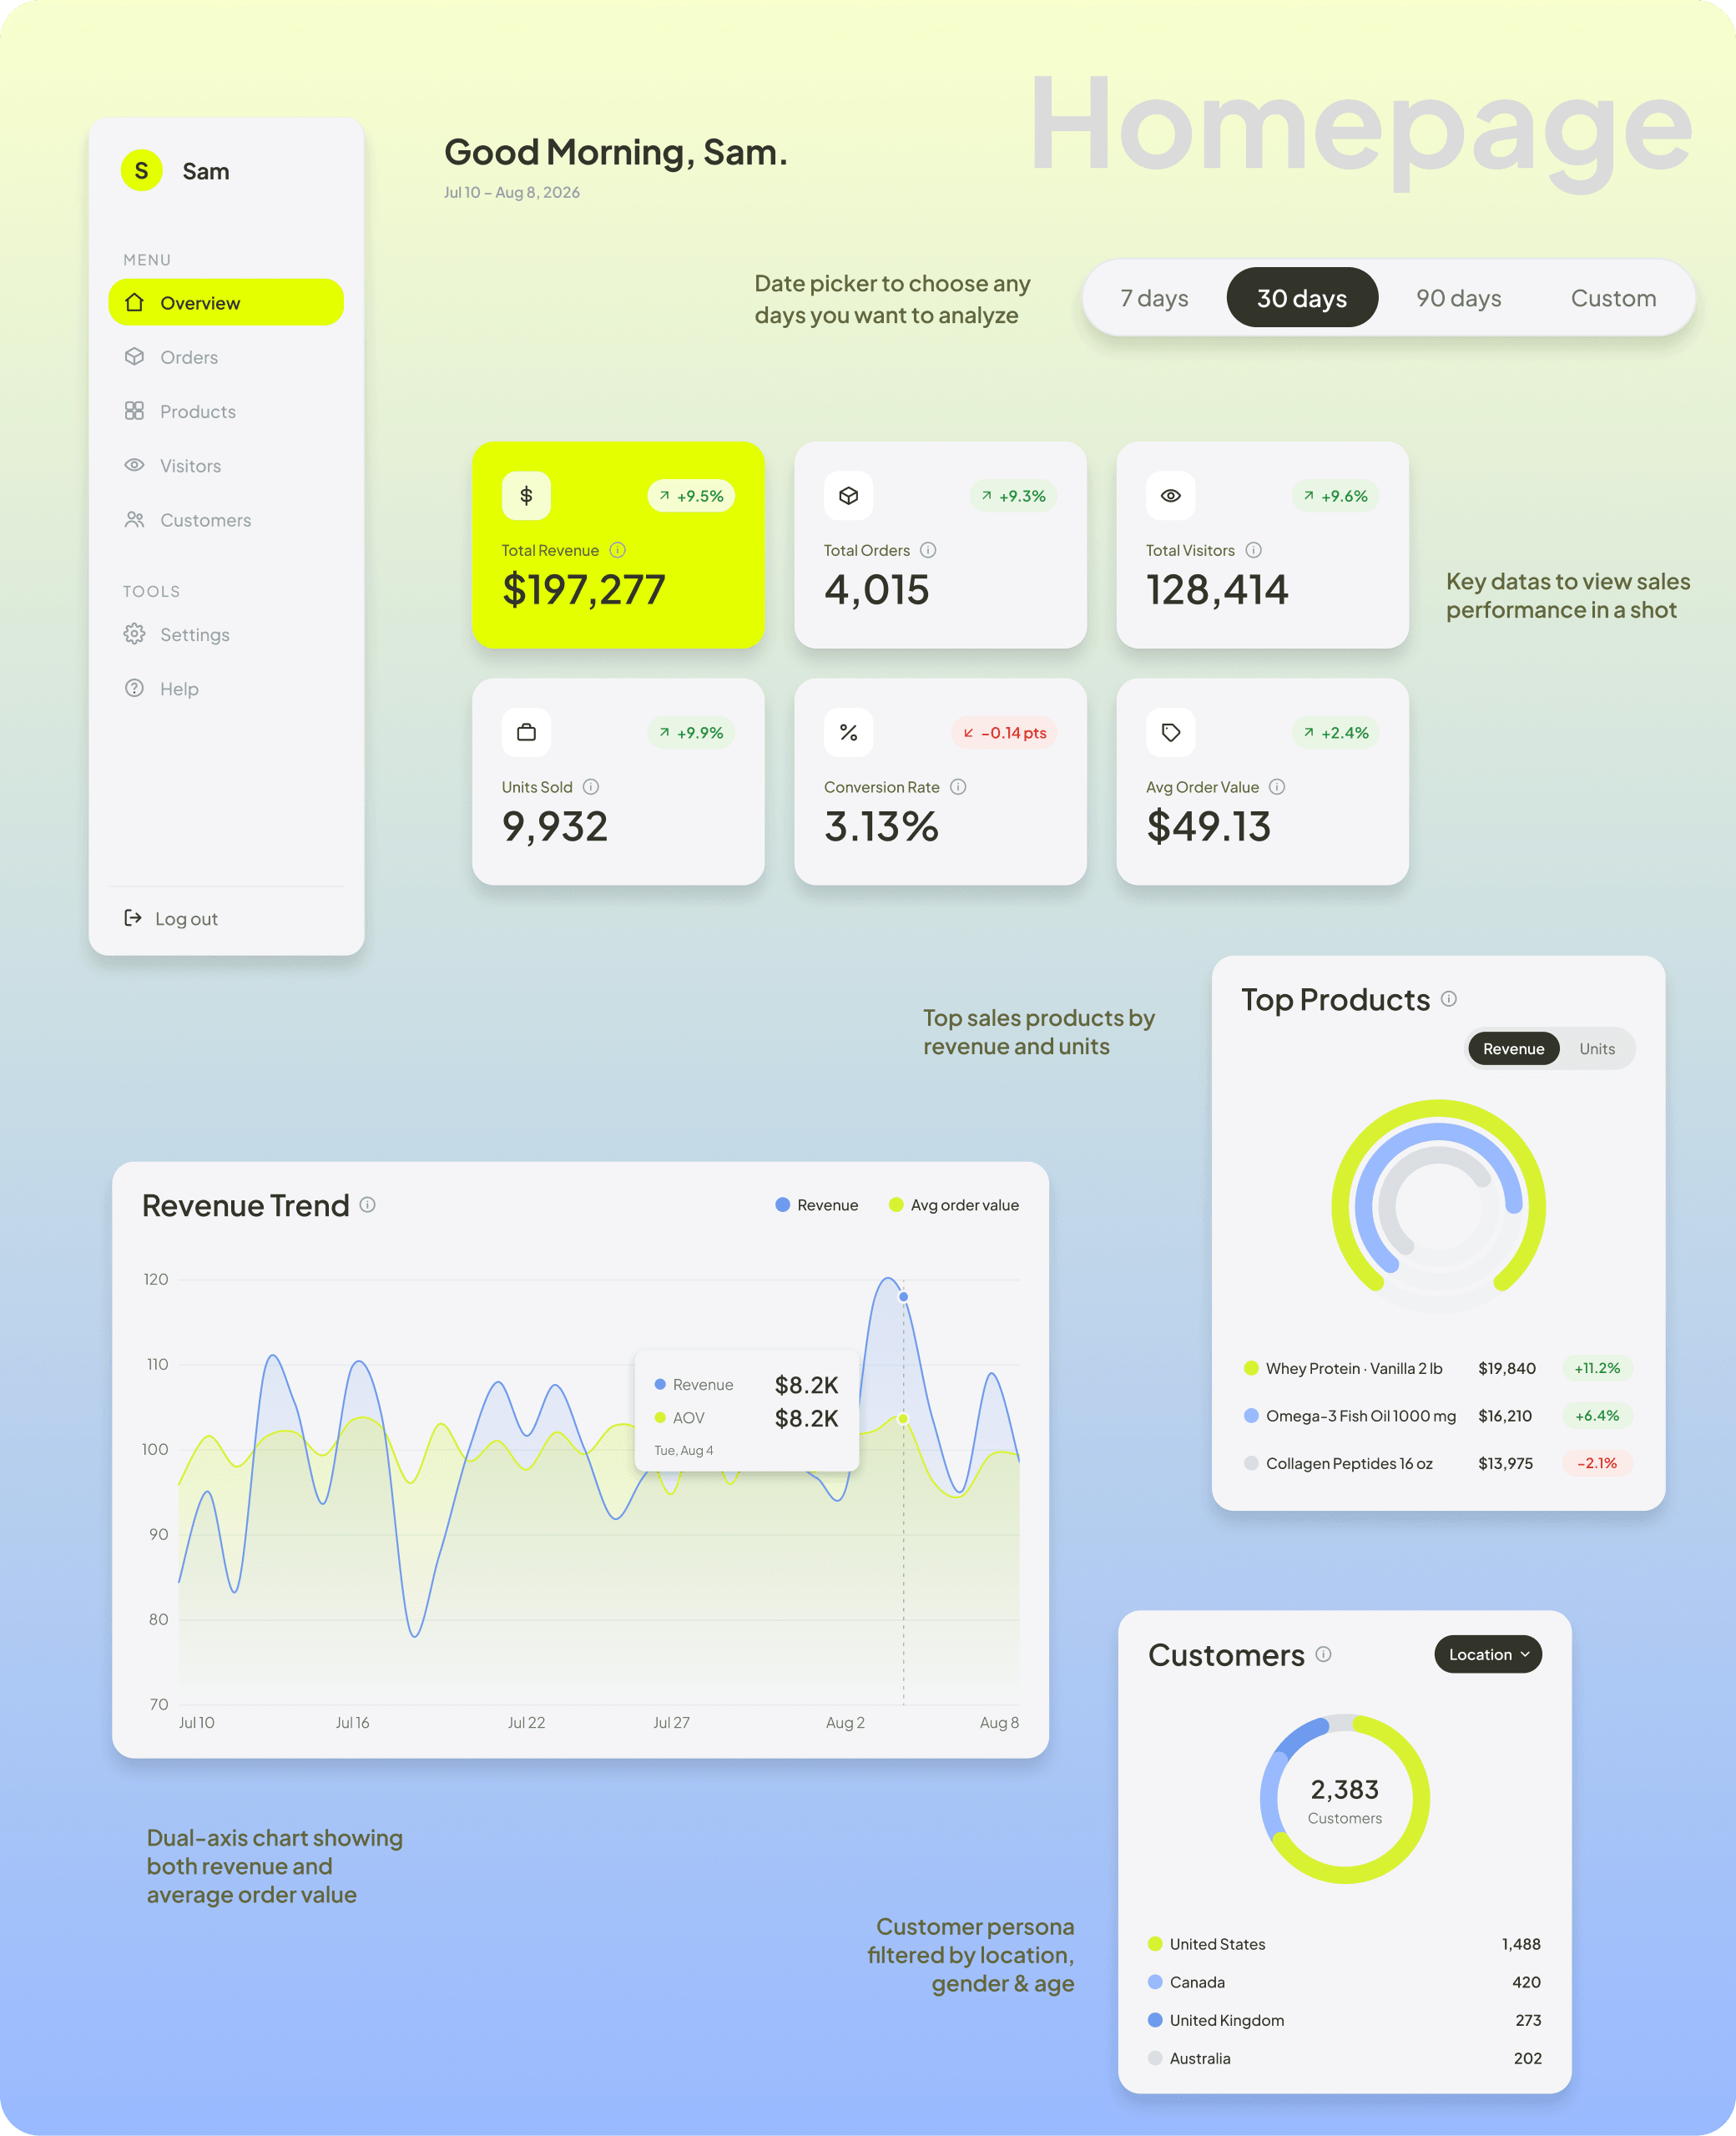
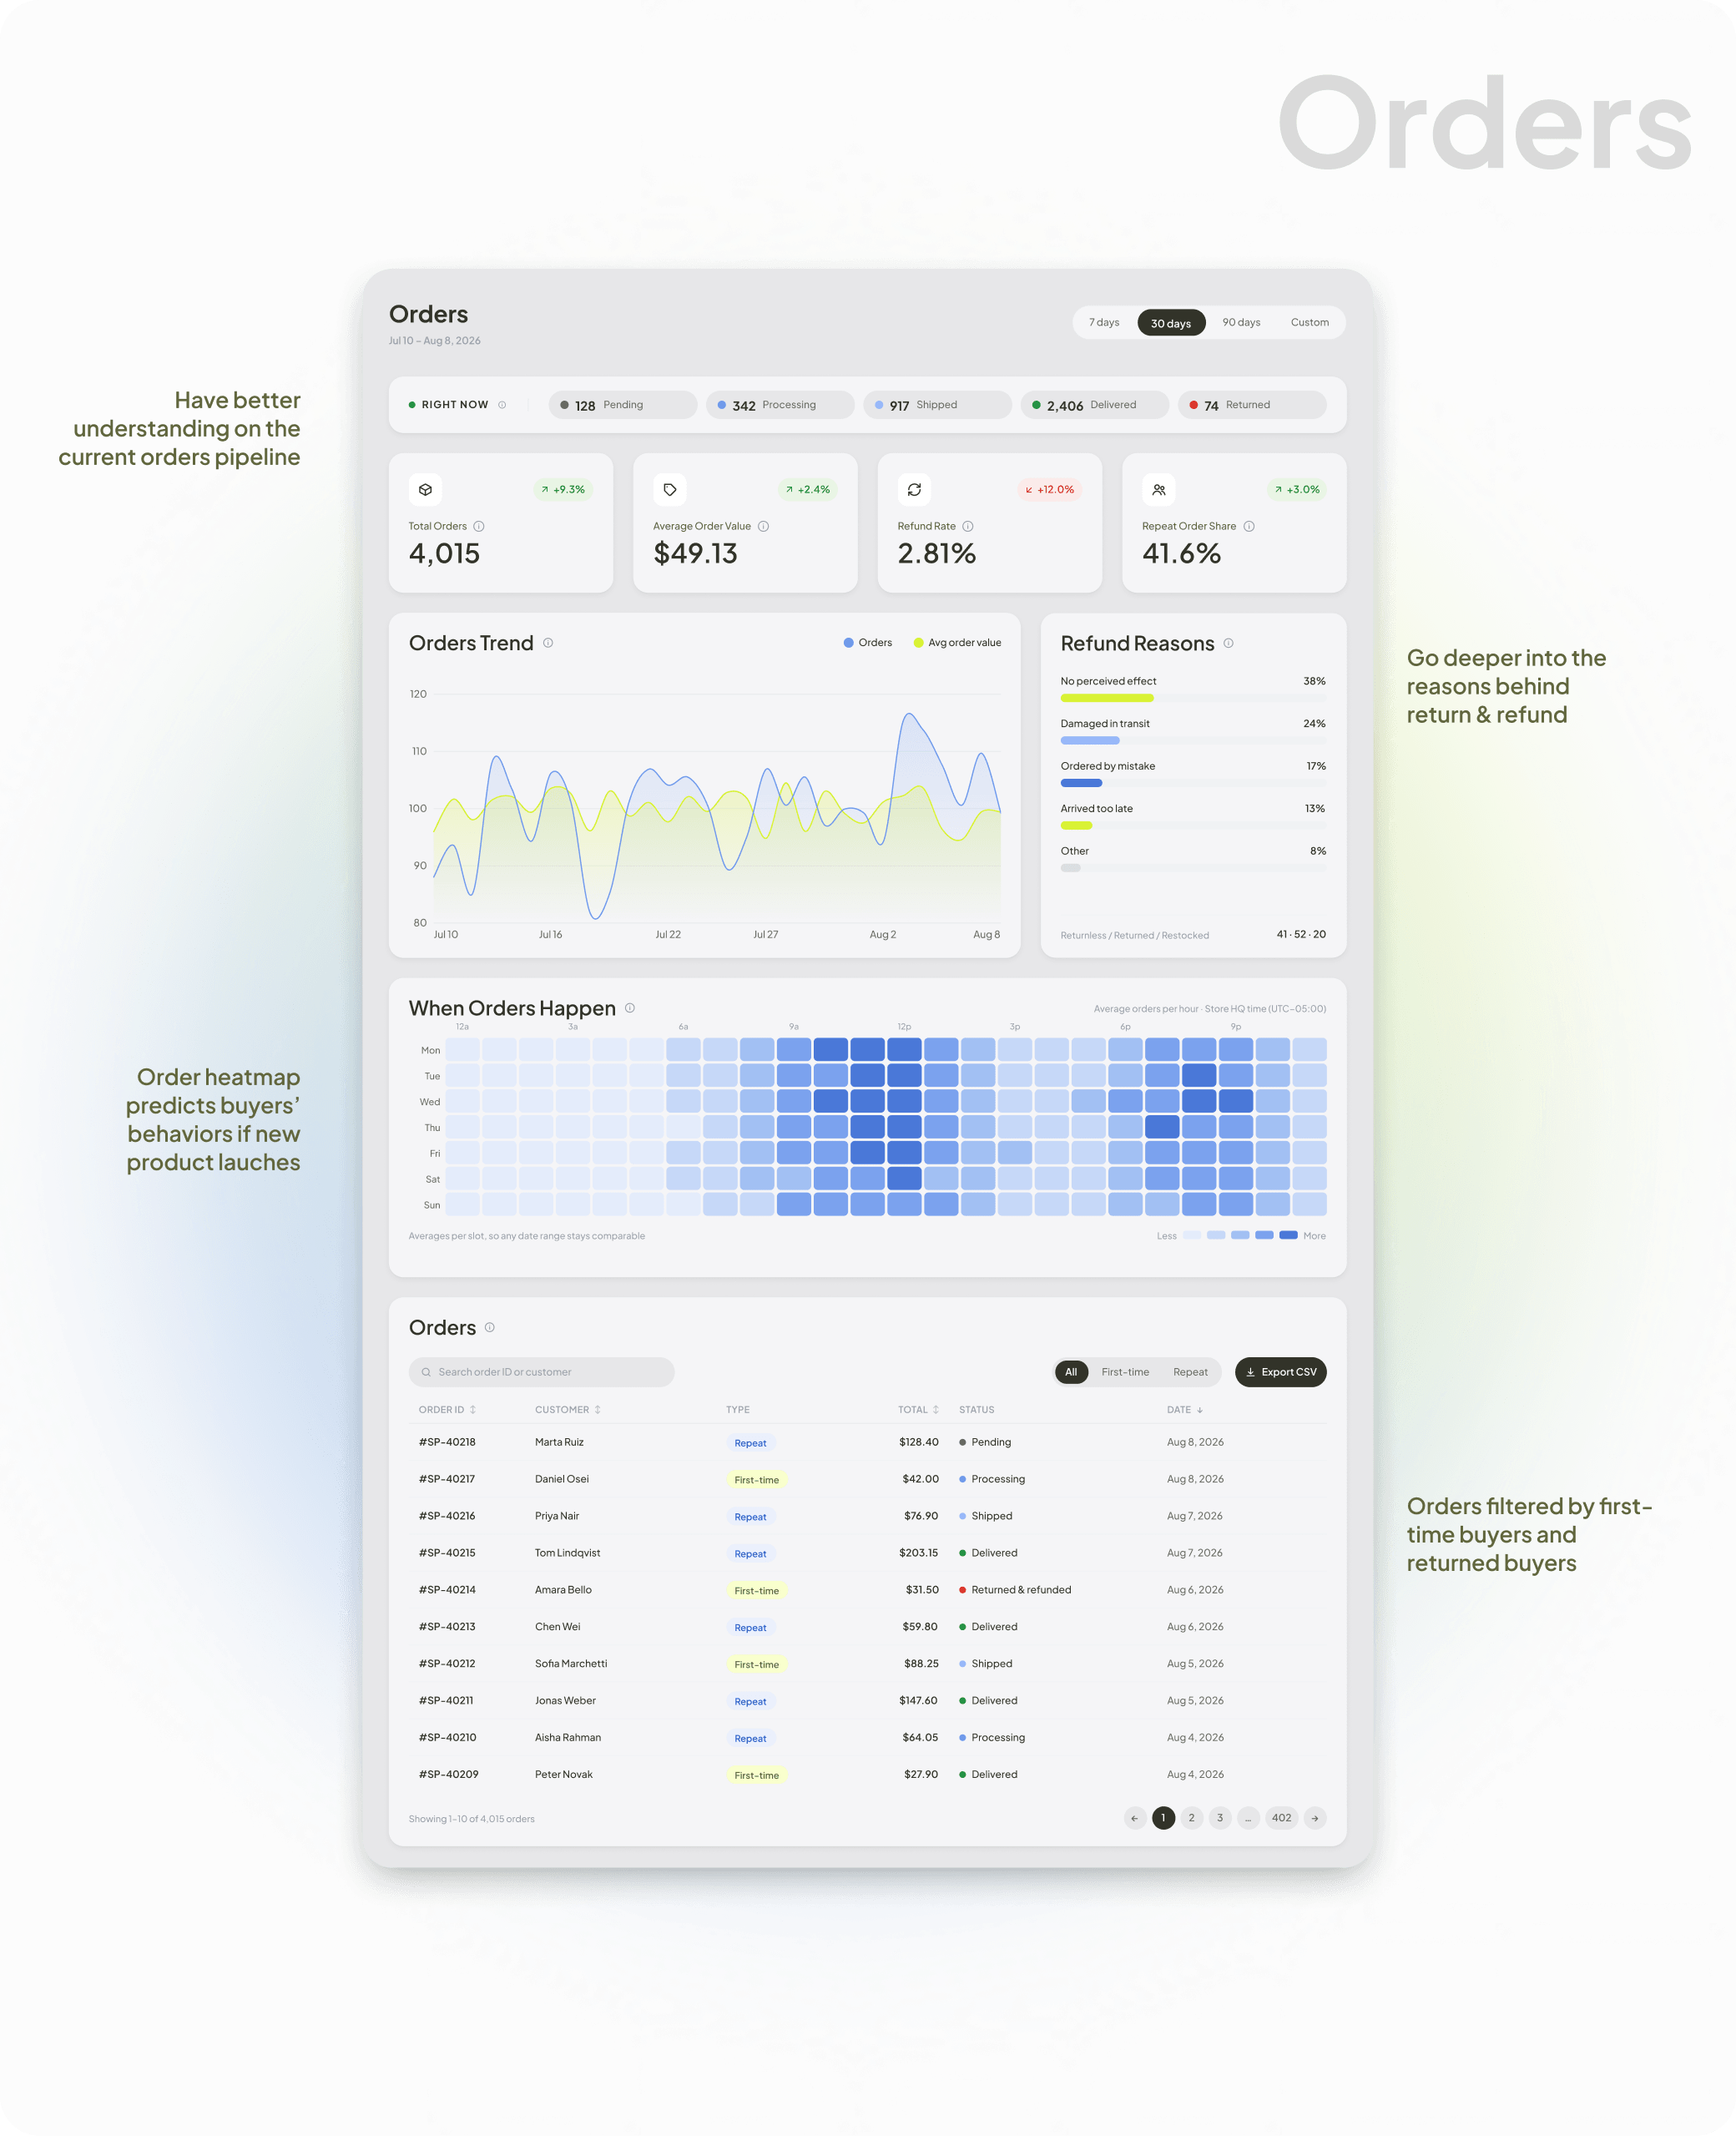
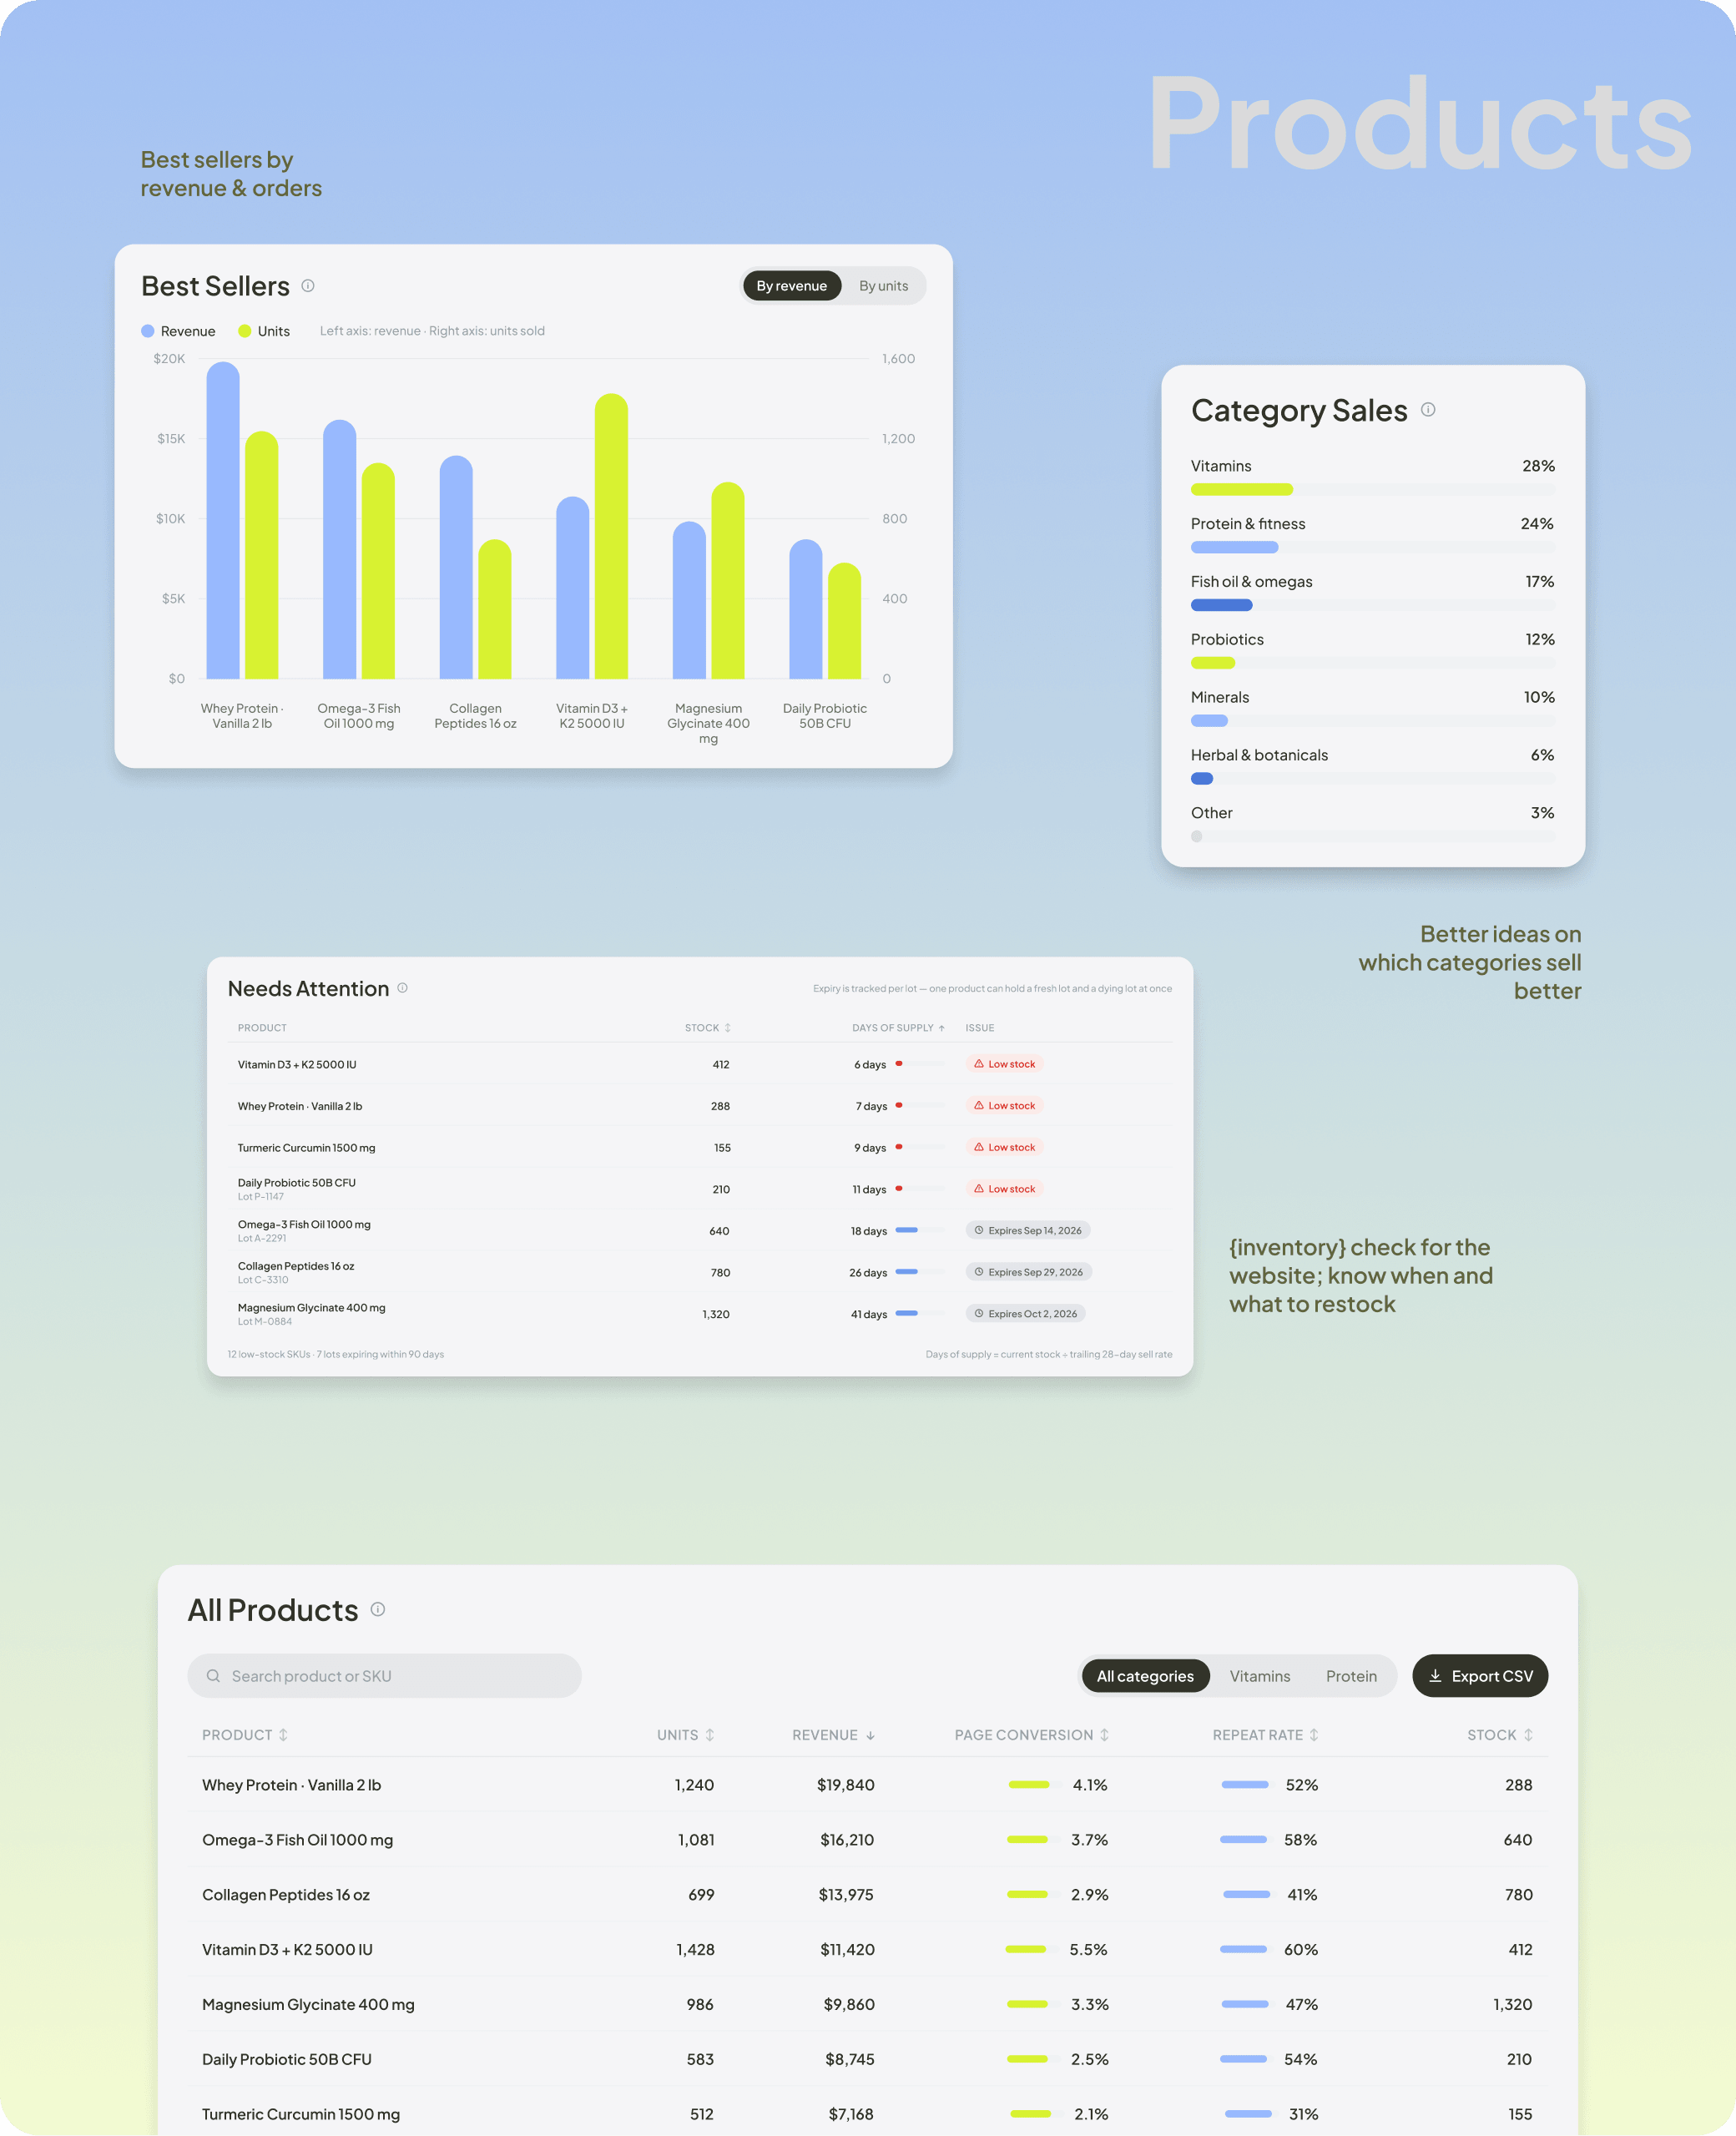
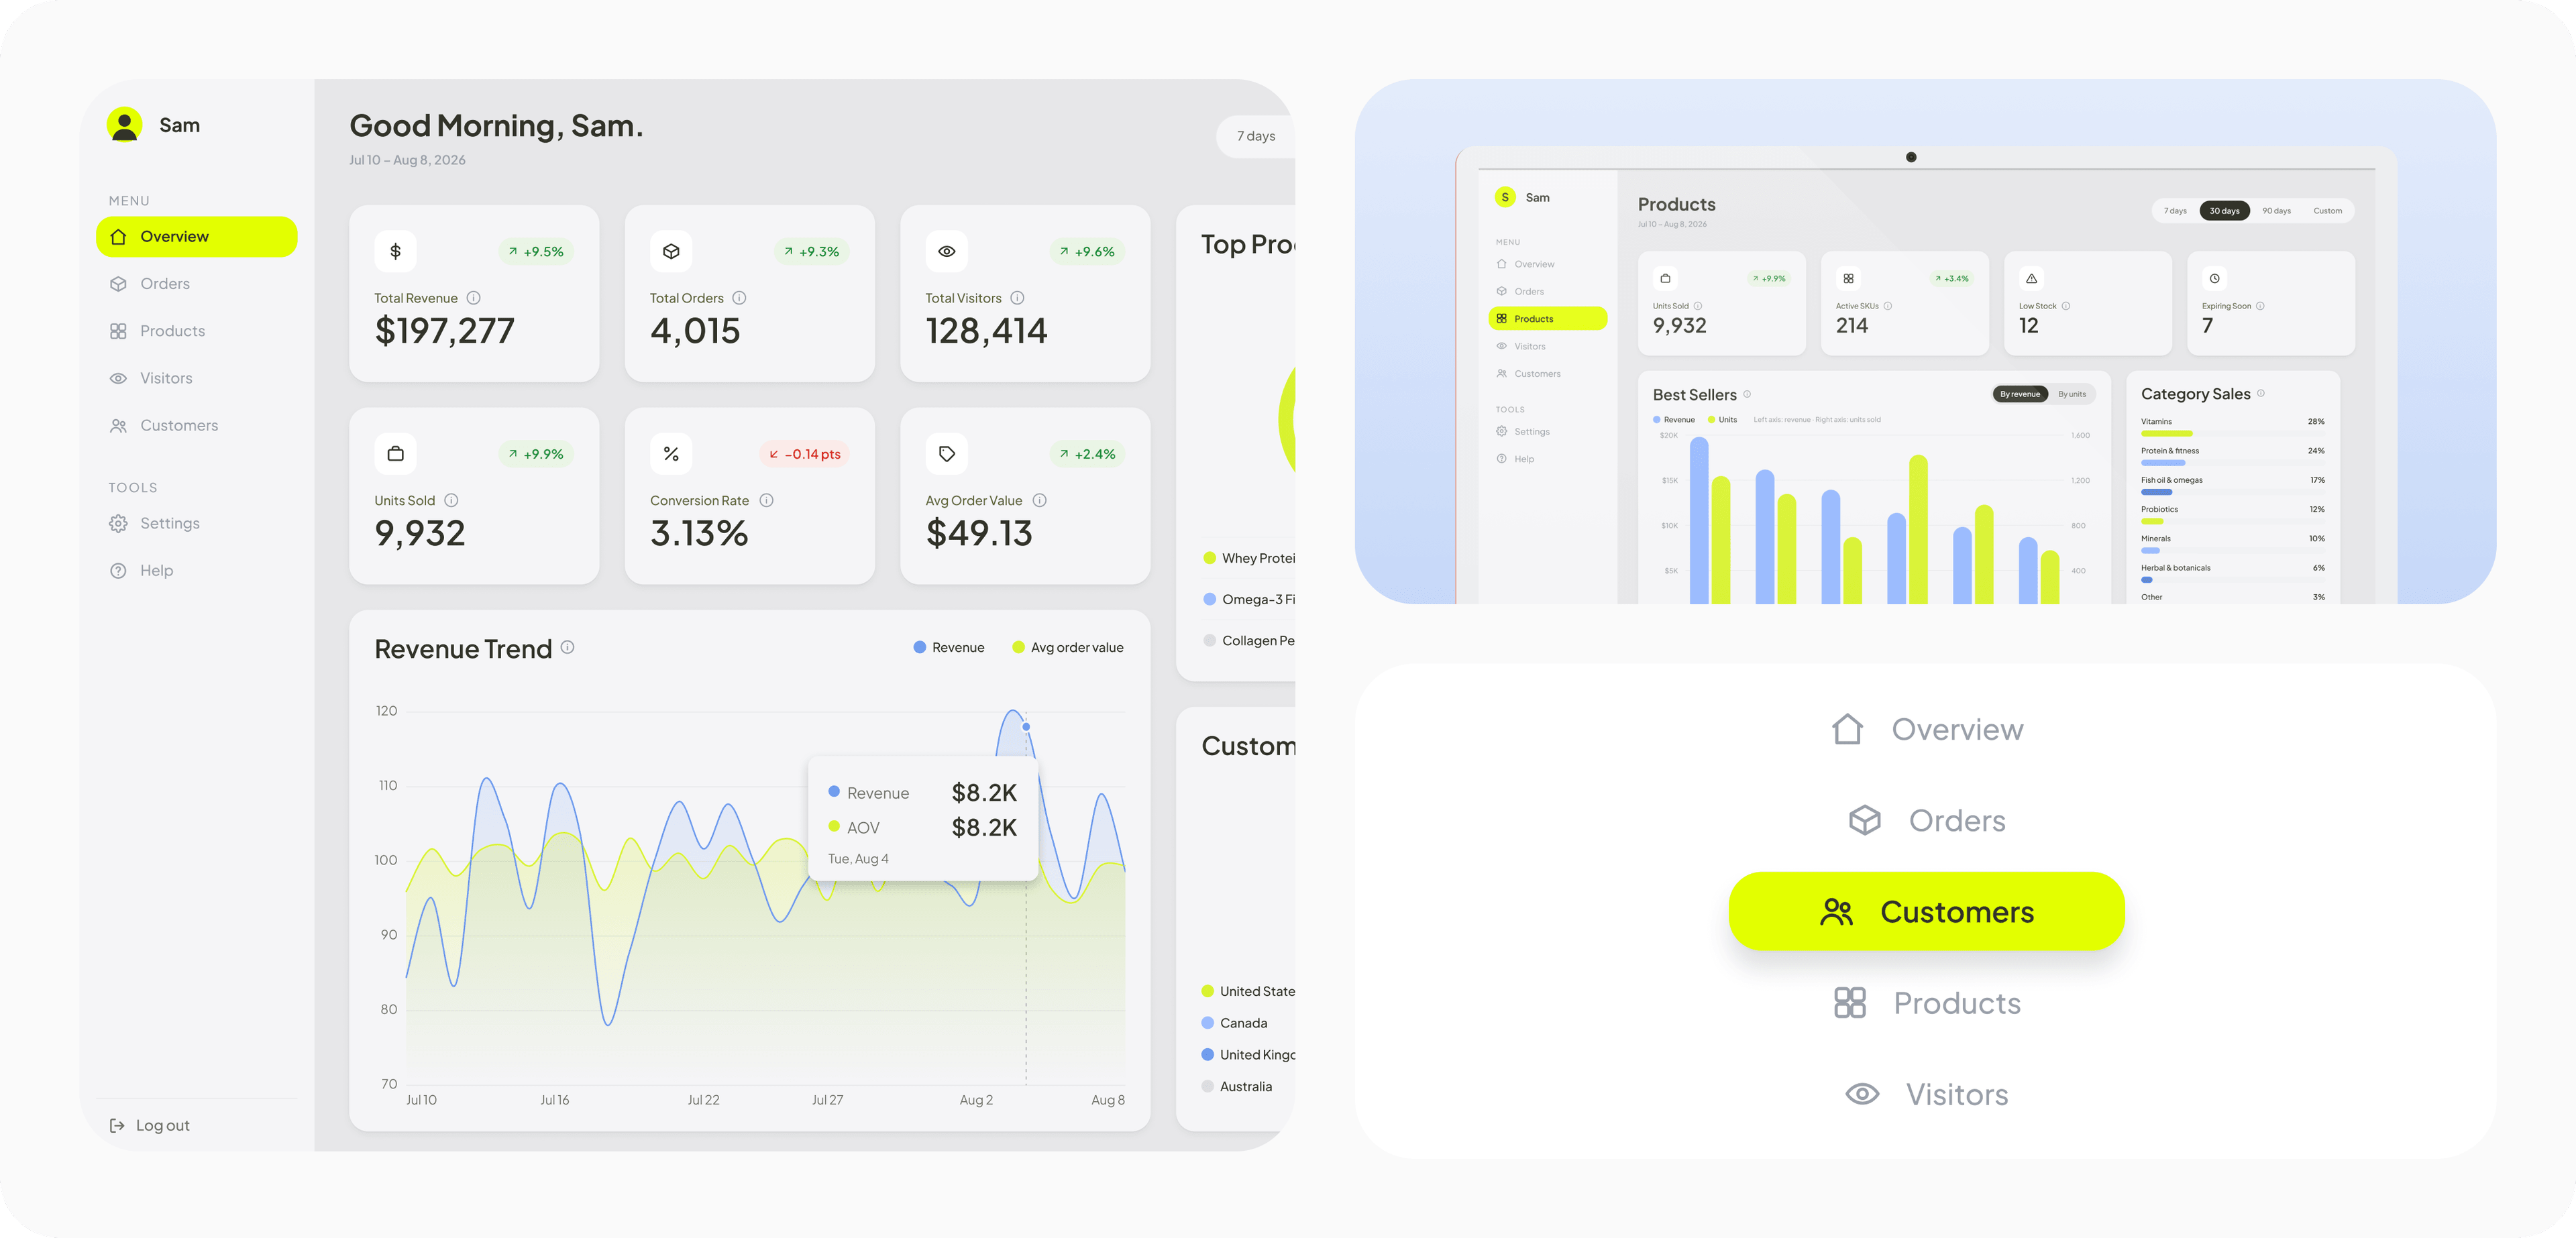
Overview — KPI cards with deltas, revenue trend and top products.Orders — pipeline status, orders trend and the order heatmap.Products — best sellers, category sales and stock needing attention.Customers and Visitors — segments, geography and traffic sources.

@2026. Designed & Built by Clemens. Powered by Claude Code.